Portuguese vs Immigrants from Nicaragua Single Female Poverty
COMPARE
Portuguese
Immigrants from Nicaragua
Single Female Poverty
Single Female Poverty Comparison
Portuguese
Immigrants from Nicaragua
20.5%
SINGLE FEMALE POVERTY
81.5/ 100
METRIC RATING
149th/ 347
METRIC RANK
21.6%
SINGLE FEMALE POVERTY
13.3/ 100
METRIC RATING
214th/ 347
METRIC RANK
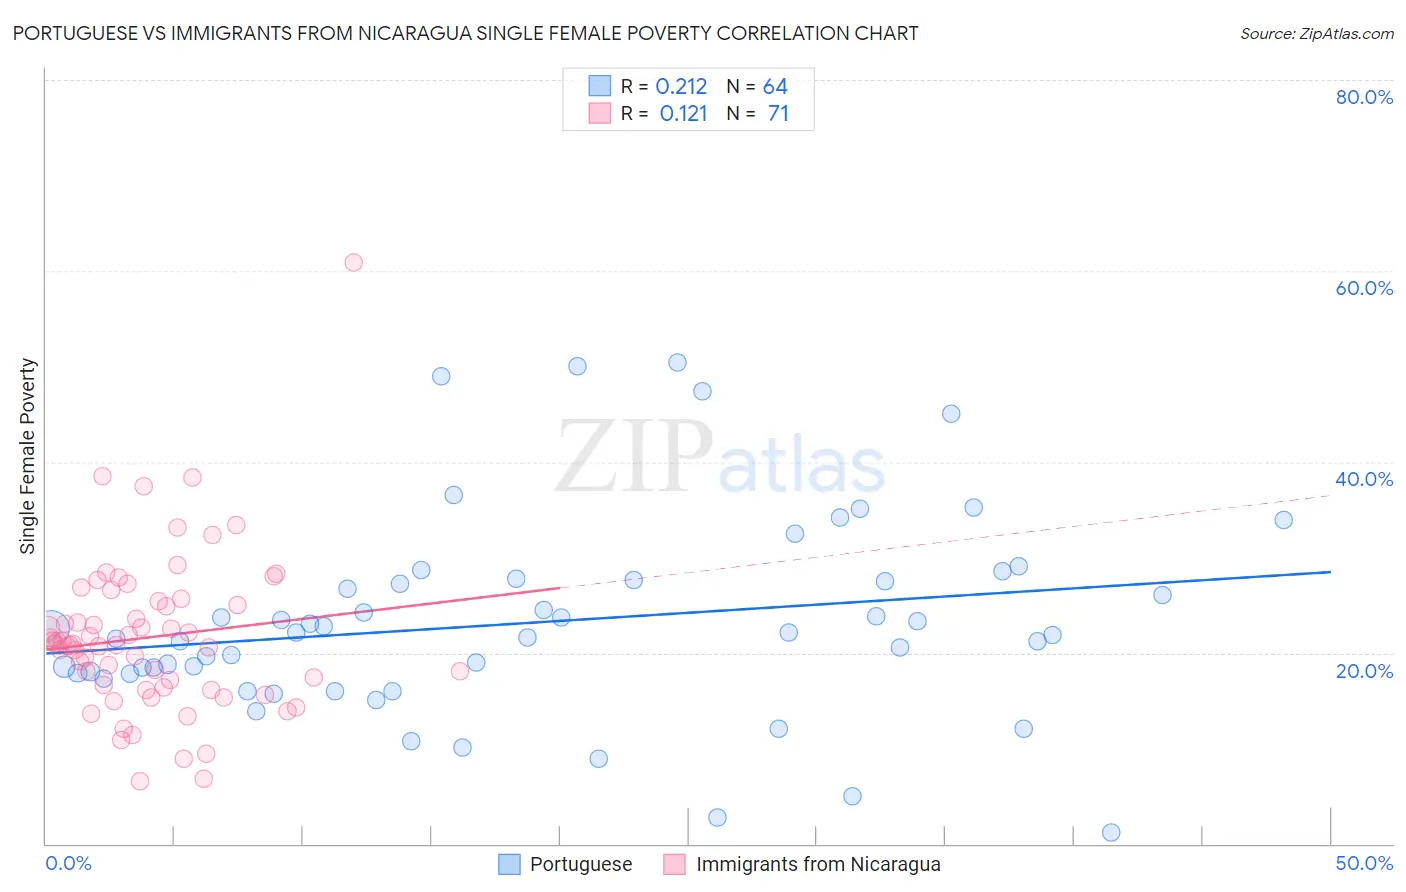
Portuguese vs Immigrants from Nicaragua Single Female Poverty Correlation Chart
The statistical analysis conducted on geographies consisting of 440,230,754 people shows a weak positive correlation between the proportion of Portuguese and poverty level among single females in the United States with a correlation coefficient (R) of 0.212 and weighted average of 20.5%. Similarly, the statistical analysis conducted on geographies consisting of 235,216,654 people shows a poor positive correlation between the proportion of Immigrants from Nicaragua and poverty level among single females in the United States with a correlation coefficient (R) of 0.121 and weighted average of 21.6%, a difference of 5.3%.
Single Female Poverty Correlation Summary
| Measurement | Portuguese | Immigrants from Nicaragua |
| Minimum | 1.2% | 6.5% |
| Maximum | 50.5% | 60.9% |
| Range | 49.2% | 54.4% |
| Mean | 23.2% | 21.6% |
| Median | 22.0% | 21.0% |
| Interquartile 25% (IQ1) | 17.8% | 16.3% |
| Interquartile 75% (IQ3) | 27.5% | 25.4% |
| Interquartile Range (IQR) | 9.7% | 9.1% |
| Standard Deviation (Sample) | 10.4% | 8.3% |
| Standard Deviation (Population) | 10.3% | 8.3% |
Similar Demographics by Single Female Poverty
Demographics Similar to Portuguese by Single Female Poverty
In terms of single female poverty, the demographic groups most similar to Portuguese are Immigrants from Denmark (20.5%, a difference of 0.10%), Puget Sound Salish (20.6%, a difference of 0.19%), Immigrants from Uruguay (20.6%, a difference of 0.38%), Luxembourger (20.4%, a difference of 0.39%), and Swedish (20.6%, a difference of 0.43%).
| Demographics | Rating | Rank | Single Female Poverty |
| Immigrants | Uganda | 89.1 /100 | #142 | Excellent 20.3% |
| Australians | 88.4 /100 | #143 | Excellent 20.3% |
| Immigrants | Uzbekistan | 88.3 /100 | #144 | Excellent 20.3% |
| Austrians | 85.8 /100 | #145 | Excellent 20.4% |
| Venezuelans | 85.5 /100 | #146 | Excellent 20.4% |
| South Africans | 85.3 /100 | #147 | Excellent 20.4% |
| Luxembourgers | 84.9 /100 | #148 | Excellent 20.4% |
| Portuguese | 81.5 /100 | #149 | Excellent 20.5% |
| Immigrants | Denmark | 80.5 /100 | #150 | Excellent 20.5% |
| Puget Sound Salish | 79.6 /100 | #151 | Good 20.6% |
| Immigrants | Uruguay | 77.7 /100 | #152 | Good 20.6% |
| Swedes | 77.1 /100 | #153 | Good 20.6% |
| Immigrants | Western Europe | 76.7 /100 | #154 | Good 20.6% |
| Samoans | 76.0 /100 | #155 | Good 20.6% |
| South American Indians | 75.7 /100 | #156 | Good 20.6% |
Demographics Similar to Immigrants from Nicaragua by Single Female Poverty
In terms of single female poverty, the demographic groups most similar to Immigrants from Nicaragua are Guamanian/Chamorro (21.6%, a difference of 0.060%), Jamaican (21.6%, a difference of 0.090%), Icelander (21.6%, a difference of 0.10%), Ecuadorian (21.6%, a difference of 0.13%), and Immigrants from Panama (21.6%, a difference of 0.14%).
| Demographics | Rating | Rank | Single Female Poverty |
| Ghanaians | 15.7 /100 | #207 | Poor 21.6% |
| Haitians | 15.4 /100 | #208 | Poor 21.6% |
| Immigrants | Eastern Africa | 15.1 /100 | #209 | Poor 21.6% |
| Immigrants | Panama | 14.4 /100 | #210 | Poor 21.6% |
| Icelanders | 14.0 /100 | #211 | Poor 21.6% |
| Jamaicans | 14.0 /100 | #212 | Poor 21.6% |
| Guamanians/Chamorros | 13.7 /100 | #213 | Poor 21.6% |
| Immigrants | Nicaragua | 13.3 /100 | #214 | Poor 21.6% |
| Ecuadorians | 12.3 /100 | #215 | Poor 21.6% |
| Immigrants | Barbados | 12.2 /100 | #216 | Poor 21.7% |
| Immigrants | St. Vincent and the Grenadines | 11.7 /100 | #217 | Poor 21.7% |
| Nepalese | 9.7 /100 | #218 | Tragic 21.7% |
| Panamanians | 9.4 /100 | #219 | Tragic 21.7% |
| Germans | 8.3 /100 | #220 | Tragic 21.8% |
| Immigrants | Grenada | 8.0 /100 | #221 | Tragic 21.8% |