Pima vs Israeli Single Mother Poverty
COMPARE
Pima
Israeli
Single Mother Poverty
Single Mother Poverty Comparison
Pima
Israelis
38.6%
SINGLE MOTHER POVERTY
0.0/ 100
METRIC RATING
338th/ 347
METRIC RANK
28.0%
SINGLE MOTHER POVERTY
96.5/ 100
METRIC RATING
105th/ 347
METRIC RANK
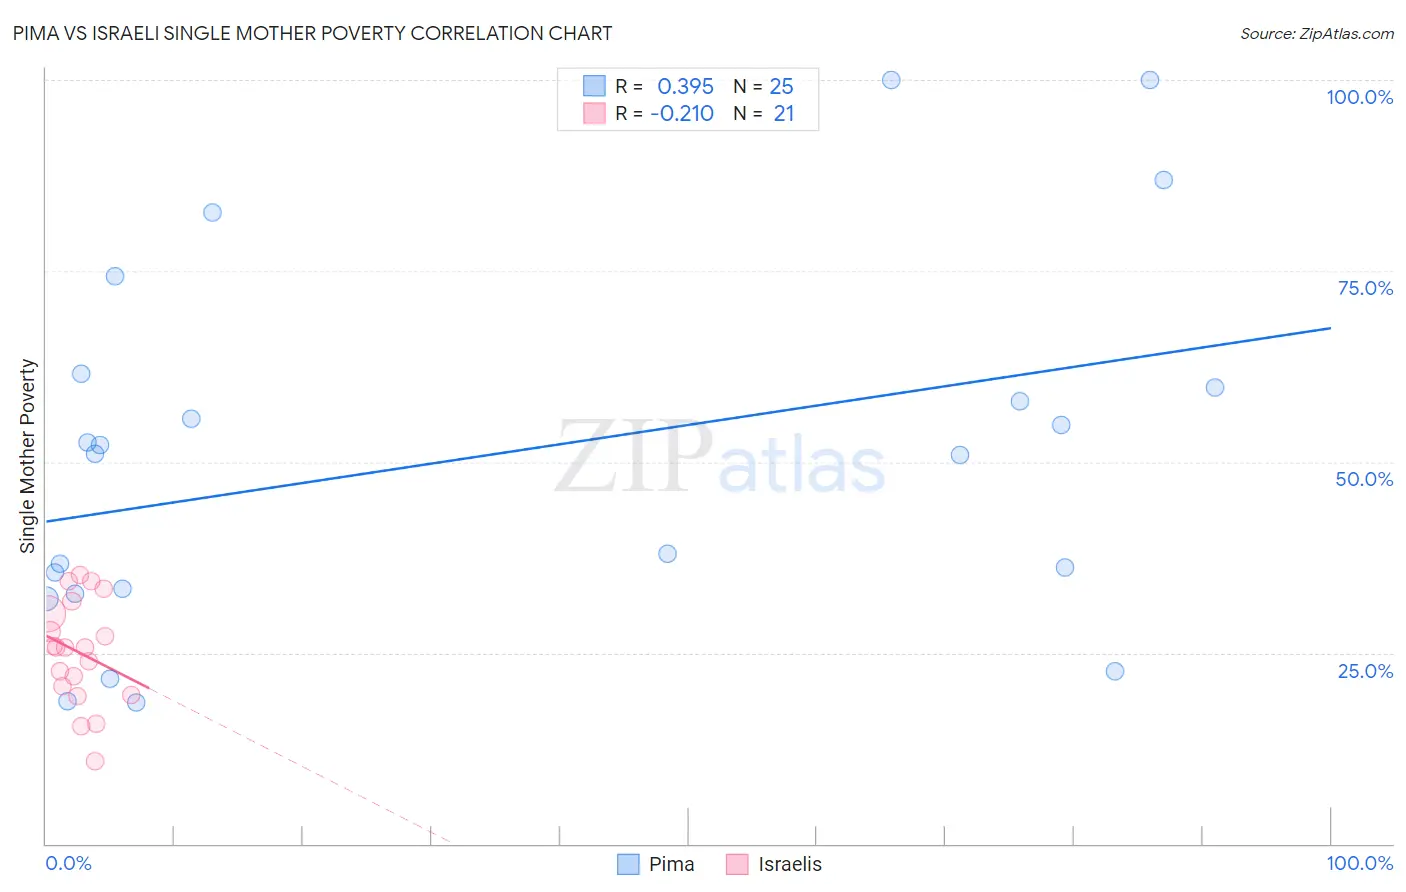
Pima vs Israeli Single Mother Poverty Correlation Chart
The statistical analysis conducted on geographies consisting of 61,247,858 people shows a mild positive correlation between the proportion of Pima and poverty level among single mothers in the United States with a correlation coefficient (R) of 0.395 and weighted average of 38.6%. Similarly, the statistical analysis conducted on geographies consisting of 207,028,427 people shows a weak negative correlation between the proportion of Israelis and poverty level among single mothers in the United States with a correlation coefficient (R) of -0.210 and weighted average of 28.0%, a difference of 37.8%.
Single Mother Poverty Correlation Summary
| Measurement | Pima | Israeli |
| Minimum | 18.5% | 10.8% |
| Maximum | 100.0% | 35.2% |
| Range | 81.5% | 24.4% |
| Mean | 50.6% | 25.1% |
| Median | 51.0% | 25.6% |
| Interquartile 25% (IQ1) | 33.1% | 20.1% |
| Interquartile 75% (IQ3) | 60.6% | 31.0% |
| Interquartile Range (IQR) | 27.5% | 10.9% |
| Standard Deviation (Sample) | 23.7% | 6.8% |
| Standard Deviation (Population) | 23.3% | 6.6% |
Similar Demographics by Single Mother Poverty
Demographics Similar to Pima by Single Mother Poverty
In terms of single mother poverty, the demographic groups most similar to Pima are Crow (38.6%, a difference of 0.090%), Immigrants from Yemen (38.5%, a difference of 0.21%), Cheyenne (38.5%, a difference of 0.25%), Sioux (38.8%, a difference of 0.49%), and Colville (39.3%, a difference of 1.8%).
| Demographics | Rating | Rank | Single Mother Poverty |
| Creek | 0.0 /100 | #331 | Tragic 36.7% |
| Dutch West Indians | 0.0 /100 | #332 | Tragic 36.8% |
| Menominee | 0.0 /100 | #333 | Tragic 37.1% |
| Pueblo | 0.0 /100 | #334 | Tragic 37.2% |
| Yuman | 0.0 /100 | #335 | Tragic 37.8% |
| Cheyenne | 0.0 /100 | #336 | Tragic 38.5% |
| Immigrants | Yemen | 0.0 /100 | #337 | Tragic 38.5% |
| Pima | 0.0 /100 | #338 | Tragic 38.6% |
| Crow | 0.0 /100 | #339 | Tragic 38.6% |
| Sioux | 0.0 /100 | #340 | Tragic 38.8% |
| Colville | 0.0 /100 | #341 | Tragic 39.3% |
| Navajo | 0.0 /100 | #342 | Tragic 40.2% |
| Cajuns | 0.0 /100 | #343 | Tragic 40.3% |
| Tohono O'odham | 0.0 /100 | #344 | Tragic 43.0% |
| Lumbee | 0.0 /100 | #345 | Tragic 43.2% |
Demographics Similar to Israelis by Single Mother Poverty
In terms of single mother poverty, the demographic groups most similar to Israelis are Italian (28.0%, a difference of 0.020%), Immigrants from Northern Africa (28.0%, a difference of 0.040%), Ukrainian (28.0%, a difference of 0.040%), Immigrants from Croatia (28.0%, a difference of 0.060%), and Pakistani (28.0%, a difference of 0.16%).
| Demographics | Rating | Rank | Single Mother Poverty |
| Immigrants | Nepal | 97.2 /100 | #98 | Exceptional 27.9% |
| Immigrants | Netherlands | 97.2 /100 | #99 | Exceptional 27.9% |
| Zimbabweans | 97.1 /100 | #100 | Exceptional 27.9% |
| Pakistanis | 96.9 /100 | #101 | Exceptional 28.0% |
| Immigrants | Croatia | 96.7 /100 | #102 | Exceptional 28.0% |
| Immigrants | Northern Africa | 96.6 /100 | #103 | Exceptional 28.0% |
| Italians | 96.6 /100 | #104 | Exceptional 28.0% |
| Israelis | 96.5 /100 | #105 | Exceptional 28.0% |
| Ukrainians | 96.4 /100 | #106 | Exceptional 28.0% |
| Immigrants | Venezuela | 95.8 /100 | #107 | Exceptional 28.1% |
| Immigrants | Zimbabwe | 95.5 /100 | #108 | Exceptional 28.1% |
| Immigrants | Armenia | 95.2 /100 | #109 | Exceptional 28.1% |
| Croatians | 94.8 /100 | #110 | Exceptional 28.2% |
| Venezuelans | 94.5 /100 | #111 | Exceptional 28.2% |
| Immigrants | Kazakhstan | 94.5 /100 | #112 | Exceptional 28.2% |