Pima vs Immigrants from Belize Single Female Poverty
COMPARE
Pima
Immigrants from Belize
Single Female Poverty
Single Female Poverty Comparison
Pima
Immigrants from Belize
30.3%
SINGLE FEMALE POVERTY
0.0/ 100
METRIC RATING
338th/ 347
METRIC RANK
22.6%
SINGLE FEMALE POVERTY
0.8/ 100
METRIC RATING
256th/ 347
METRIC RANK
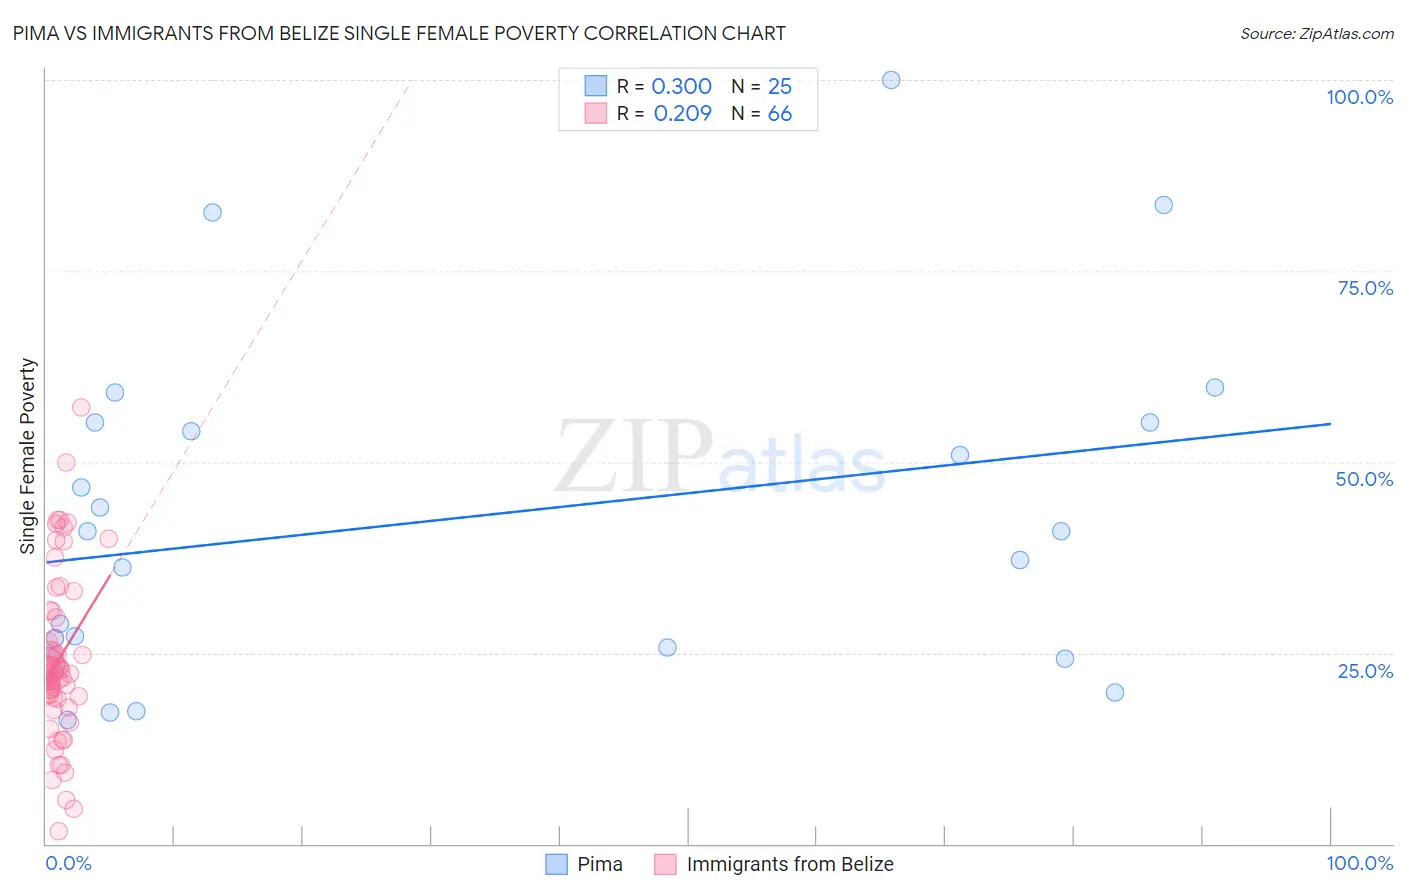
Pima vs Immigrants from Belize Single Female Poverty Correlation Chart
The statistical analysis conducted on geographies consisting of 61,414,275 people shows a mild positive correlation between the proportion of Pima and poverty level among single females in the United States with a correlation coefficient (R) of 0.300 and weighted average of 30.3%. Similarly, the statistical analysis conducted on geographies consisting of 129,926,681 people shows a weak positive correlation between the proportion of Immigrants from Belize and poverty level among single females in the United States with a correlation coefficient (R) of 0.209 and weighted average of 22.6%, a difference of 34.2%.
Single Female Poverty Correlation Summary
| Measurement | Pima | Immigrants from Belize |
| Minimum | 16.1% | 1.7% |
| Maximum | 100.0% | 57.1% |
| Range | 83.9% | 55.5% |
| Mean | 42.9% | 24.1% |
| Median | 41.0% | 22.5% |
| Interquartile 25% (IQ1) | 24.9% | 19.1% |
| Interquartile 75% (IQ3) | 55.1% | 29.6% |
| Interquartile Range (IQR) | 30.2% | 10.5% |
| Standard Deviation (Sample) | 22.3% | 10.9% |
| Standard Deviation (Population) | 21.8% | 10.8% |
Similar Demographics by Single Female Poverty
Demographics Similar to Pima by Single Female Poverty
In terms of single female poverty, the demographic groups most similar to Pima are Cheyenne (30.4%, a difference of 0.22%), Cajun (30.6%, a difference of 1.0%), Yuman (29.4%, a difference of 3.0%), Sioux (31.3%, a difference of 3.0%), and Colville (29.1%, a difference of 4.3%).
| Demographics | Rating | Rank | Single Female Poverty |
| Natives/Alaskans | 0.0 /100 | #331 | Tragic 28.2% |
| Yakama | 0.0 /100 | #332 | Tragic 28.3% |
| Ute | 0.0 /100 | #333 | Tragic 28.4% |
| Pueblo | 0.0 /100 | #334 | Tragic 28.6% |
| Immigrants | Yemen | 0.0 /100 | #335 | Tragic 28.9% |
| Colville | 0.0 /100 | #336 | Tragic 29.1% |
| Yuman | 0.0 /100 | #337 | Tragic 29.4% |
| Pima | 0.0 /100 | #338 | Tragic 30.3% |
| Cheyenne | 0.0 /100 | #339 | Tragic 30.4% |
| Cajuns | 0.0 /100 | #340 | Tragic 30.6% |
| Sioux | 0.0 /100 | #341 | Tragic 31.3% |
| Navajo | 0.0 /100 | #342 | Tragic 31.7% |
| Crow | 0.0 /100 | #343 | Tragic 32.4% |
| Lumbee | 0.0 /100 | #344 | Tragic 33.0% |
| Houma | 0.0 /100 | #345 | Tragic 33.8% |
Demographics Similar to Immigrants from Belize by Single Female Poverty
In terms of single female poverty, the demographic groups most similar to Immigrants from Belize are Immigrants from Sudan (22.6%, a difference of 0.14%), Sudanese (22.6%, a difference of 0.14%), Immigrants from Burma/Myanmar (22.6%, a difference of 0.15%), Immigrants from Liberia (22.5%, a difference of 0.25%), and Delaware (22.5%, a difference of 0.34%).
| Demographics | Rating | Rank | Single Female Poverty |
| Immigrants | Caribbean | 1.3 /100 | #249 | Tragic 22.4% |
| Immigrants | Bahamas | 1.2 /100 | #250 | Tragic 22.5% |
| Immigrants | West Indies | 1.0 /100 | #251 | Tragic 22.5% |
| Delaware | 1.0 /100 | #252 | Tragic 22.5% |
| Immigrants | Liberia | 0.9 /100 | #253 | Tragic 22.5% |
| Immigrants | Burma/Myanmar | 0.8 /100 | #254 | Tragic 22.6% |
| Immigrants | Sudan | 0.8 /100 | #255 | Tragic 22.6% |
| Immigrants | Belize | 0.8 /100 | #256 | Tragic 22.6% |
| Sudanese | 0.7 /100 | #257 | Tragic 22.6% |
| Bahamians | 0.6 /100 | #258 | Tragic 22.7% |
| Whites/Caucasians | 0.6 /100 | #259 | Tragic 22.7% |
| Celtics | 0.5 /100 | #260 | Tragic 22.7% |
| Immigrants | Cabo Verde | 0.4 /100 | #261 | Tragic 22.8% |
| British West Indians | 0.4 /100 | #262 | Tragic 22.8% |
| Scotch-Irish | 0.3 /100 | #263 | Tragic 22.9% |