Pennsylvania German vs Immigrants from Belarus Single Female Poverty
COMPARE
Pennsylvania German
Immigrants from Belarus
Single Female Poverty
Single Female Poverty Comparison
Pennsylvania Germans
Immigrants from Belarus
23.6%
SINGLE FEMALE POVERTY
0.0/ 100
METRIC RATING
277th/ 347
METRIC RANK
19.3%
SINGLE FEMALE POVERTY
99.4/ 100
METRIC RATING
74th/ 347
METRIC RANK
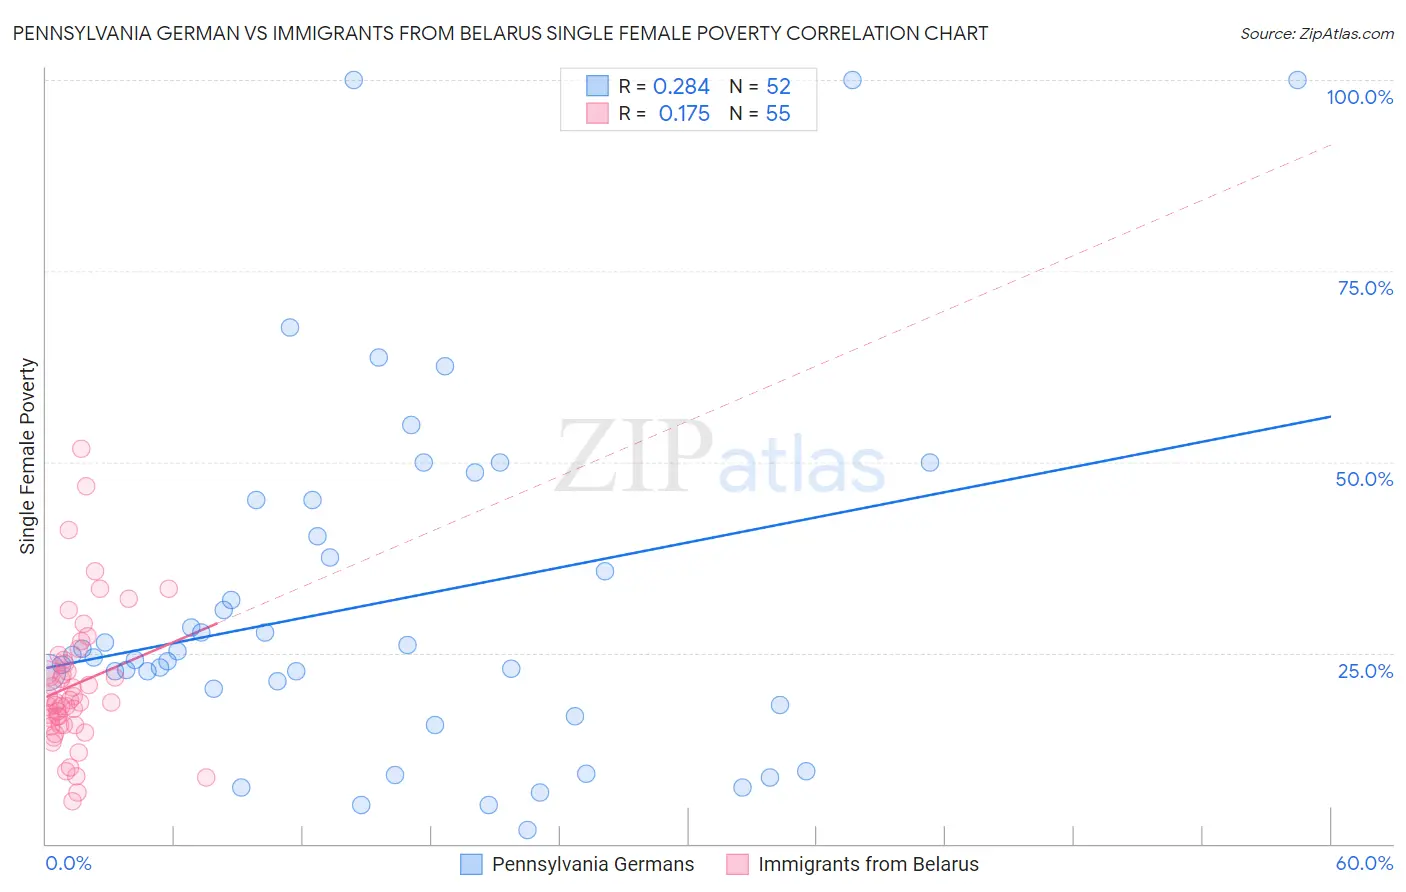
Pennsylvania German vs Immigrants from Belarus Single Female Poverty Correlation Chart
The statistical analysis conducted on geographies consisting of 231,066,228 people shows a weak positive correlation between the proportion of Pennsylvania Germans and poverty level among single females in the United States with a correlation coefficient (R) of 0.284 and weighted average of 23.6%. Similarly, the statistical analysis conducted on geographies consisting of 149,021,334 people shows a poor positive correlation between the proportion of Immigrants from Belarus and poverty level among single females in the United States with a correlation coefficient (R) of 0.175 and weighted average of 19.3%, a difference of 21.8%.
Single Female Poverty Correlation Summary
| Measurement | Pennsylvania German | Immigrants from Belarus |
| Minimum | 1.8% | 5.6% |
| Maximum | 100.0% | 51.6% |
| Range | 98.2% | 46.1% |
| Mean | 31.6% | 20.8% |
| Median | 24.5% | 18.5% |
| Interquartile 25% (IQ1) | 19.2% | 15.5% |
| Interquartile 75% (IQ3) | 42.6% | 24.1% |
| Interquartile Range (IQR) | 23.4% | 8.6% |
| Standard Deviation (Sample) | 23.3% | 9.1% |
| Standard Deviation (Population) | 23.1% | 9.0% |
Similar Demographics by Single Female Poverty
Demographics Similar to Pennsylvania Germans by Single Female Poverty
In terms of single female poverty, the demographic groups most similar to Pennsylvania Germans are Nonimmigrants (23.6%, a difference of 0.080%), Alaskan Athabascan (23.6%, a difference of 0.11%), Immigrants from the Azores (23.5%, a difference of 0.15%), Immigrants from Latin America (23.7%, a difference of 0.60%), and Mexican American Indian (23.4%, a difference of 0.94%).
| Demographics | Rating | Rank | Single Female Poverty |
| Inupiat | 0.2 /100 | #270 | Tragic 23.1% |
| Sub-Saharan Africans | 0.1 /100 | #271 | Tragic 23.2% |
| Immigrants | Senegal | 0.1 /100 | #272 | Tragic 23.2% |
| Alaska Natives | 0.1 /100 | #273 | Tragic 23.3% |
| Marshallese | 0.1 /100 | #274 | Tragic 23.3% |
| Mexican American Indians | 0.1 /100 | #275 | Tragic 23.4% |
| Immigrants | Azores | 0.0 /100 | #276 | Tragic 23.5% |
| Pennsylvania Germans | 0.0 /100 | #277 | Tragic 23.6% |
| Immigrants | Nonimmigrants | 0.0 /100 | #278 | Tragic 23.6% |
| Alaskan Athabascans | 0.0 /100 | #279 | Tragic 23.6% |
| Immigrants | Latin America | 0.0 /100 | #280 | Tragic 23.7% |
| Immigrants | Zaire | 0.0 /100 | #281 | Tragic 23.8% |
| Guatemalans | 0.0 /100 | #282 | Tragic 23.8% |
| German Russians | 0.0 /100 | #283 | Tragic 23.9% |
| Immigrants | Dominica | 0.0 /100 | #284 | Tragic 23.9% |
Demographics Similar to Immigrants from Belarus by Single Female Poverty
In terms of single female poverty, the demographic groups most similar to Immigrants from Belarus are Immigrants from Peru (19.3%, a difference of 0.010%), Immigrants from Turkey (19.4%, a difference of 0.040%), Peruvian (19.4%, a difference of 0.070%), Immigrants from Latvia (19.3%, a difference of 0.11%), and Immigrants from South Eastern Asia (19.3%, a difference of 0.12%).
| Demographics | Rating | Rank | Single Female Poverty |
| Immigrants | Egypt | 99.6 /100 | #67 | Exceptional 19.2% |
| Laotians | 99.5 /100 | #68 | Exceptional 19.3% |
| Paraguayans | 99.5 /100 | #69 | Exceptional 19.3% |
| Immigrants | Jordan | 99.4 /100 | #70 | Exceptional 19.3% |
| Immigrants | South Eastern Asia | 99.4 /100 | #71 | Exceptional 19.3% |
| Immigrants | Latvia | 99.4 /100 | #72 | Exceptional 19.3% |
| Immigrants | Peru | 99.4 /100 | #73 | Exceptional 19.3% |
| Immigrants | Belarus | 99.4 /100 | #74 | Exceptional 19.3% |
| Immigrants | Turkey | 99.4 /100 | #75 | Exceptional 19.4% |
| Peruvians | 99.4 /100 | #76 | Exceptional 19.4% |
| Immigrants | Russia | 99.3 /100 | #77 | Exceptional 19.4% |
| Albanians | 99.3 /100 | #78 | Exceptional 19.4% |
| Immigrants | Sierra Leone | 99.3 /100 | #79 | Exceptional 19.4% |
| Immigrants | Australia | 99.3 /100 | #80 | Exceptional 19.4% |
| Immigrants | Scotland | 99.2 /100 | #81 | Exceptional 19.4% |