Okinawan vs Aleut Family Poverty
COMPARE
Okinawan
Aleut
Family Poverty
Family Poverty Comparison
Okinawans
Aleuts
7.7%
FAMILY POVERTY
98.9/ 100
METRIC RATING
45th/ 347
METRIC RANK
9.5%
FAMILY POVERTY
18.0/ 100
METRIC RATING
205th/ 347
METRIC RANK
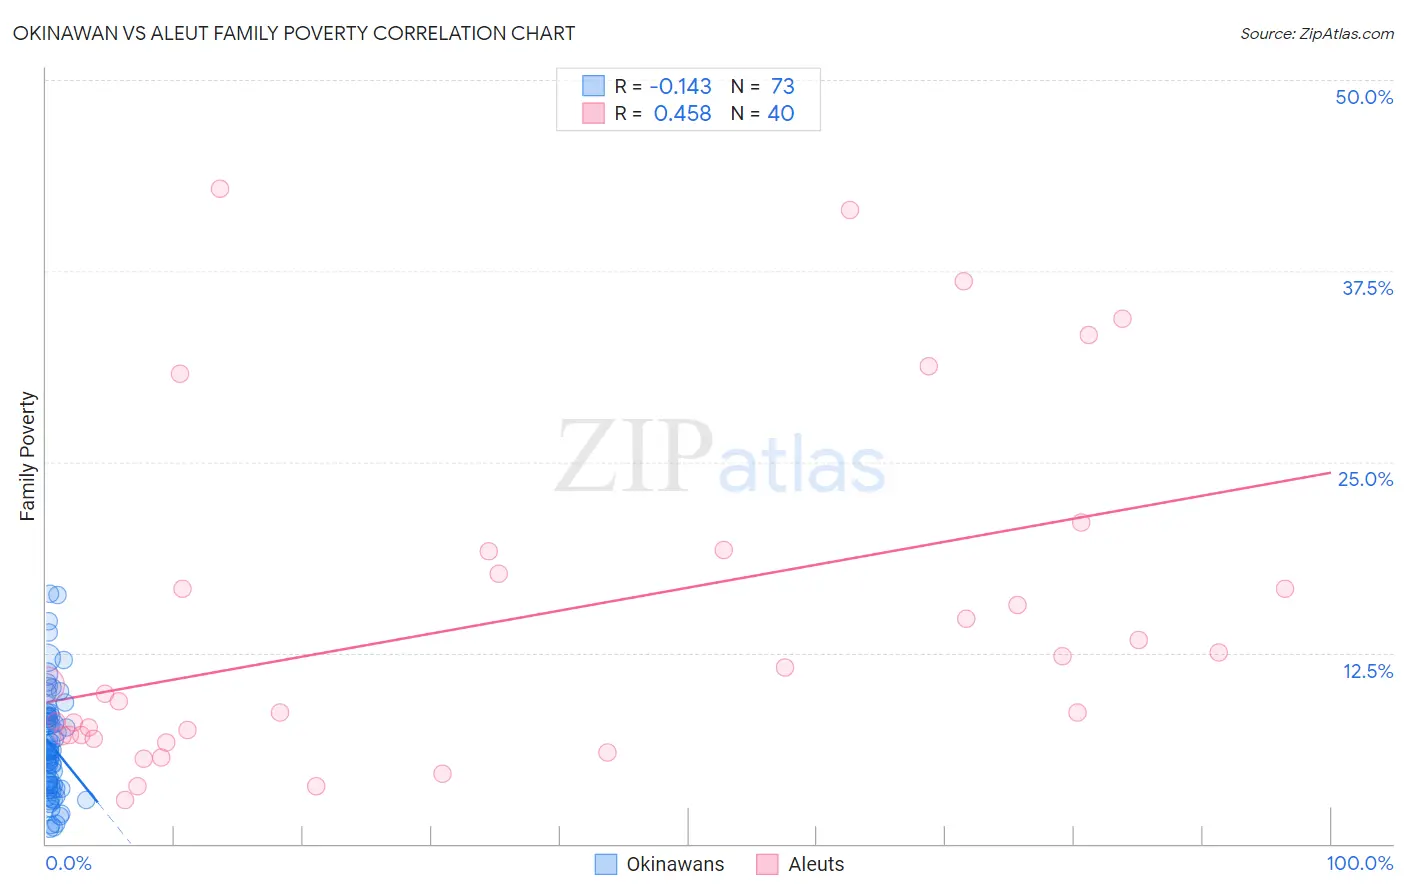
Okinawan vs Aleut Family Poverty Correlation Chart
The statistical analysis conducted on geographies consisting of 73,642,678 people shows a poor negative correlation between the proportion of Okinawans and poverty level among families in the United States with a correlation coefficient (R) of -0.143 and weighted average of 7.7%. Similarly, the statistical analysis conducted on geographies consisting of 61,739,595 people shows a moderate positive correlation between the proportion of Aleuts and poverty level among families in the United States with a correlation coefficient (R) of 0.458 and weighted average of 9.5%, a difference of 23.3%.
Family Poverty Correlation Summary
| Measurement | Okinawan | Aleut |
| Minimum | 1.0% | 2.9% |
| Maximum | 16.4% | 42.9% |
| Range | 15.4% | 40.0% |
| Mean | 6.4% | 14.6% |
| Median | 6.0% | 10.1% |
| Interquartile 25% (IQ1) | 3.7% | 7.1% |
| Interquartile 75% (IQ3) | 8.4% | 18.4% |
| Interquartile Range (IQR) | 4.6% | 11.3% |
| Standard Deviation (Sample) | 3.5% | 11.0% |
| Standard Deviation (Population) | 3.5% | 10.9% |
Similar Demographics by Family Poverty
Demographics Similar to Okinawans by Family Poverty
In terms of family poverty, the demographic groups most similar to Okinawans are Tongan (7.7%, a difference of 0.010%), Immigrants from Czechoslovakia (7.7%, a difference of 0.030%), Immigrants from Sri Lanka (7.7%, a difference of 0.040%), German (7.7%, a difference of 0.12%), and Immigrants from Bolivia (7.7%, a difference of 0.23%).
| Demographics | Rating | Rank | Family Poverty |
| Bolivians | 99.3 /100 | #38 | Exceptional 7.5% |
| Carpatho Rusyns | 99.3 /100 | #39 | Exceptional 7.5% |
| Slovenes | 99.3 /100 | #40 | Exceptional 7.5% |
| Immigrants | Australia | 99.2 /100 | #41 | Exceptional 7.6% |
| Scandinavians | 99.1 /100 | #42 | Exceptional 7.6% |
| Immigrants | Austria | 99.1 /100 | #43 | Exceptional 7.6% |
| Germans | 99.0 /100 | #44 | Exceptional 7.7% |
| Okinawans | 98.9 /100 | #45 | Exceptional 7.7% |
| Tongans | 98.9 /100 | #46 | Exceptional 7.7% |
| Immigrants | Czechoslovakia | 98.9 /100 | #47 | Exceptional 7.7% |
| Immigrants | Sri Lanka | 98.9 /100 | #48 | Exceptional 7.7% |
| Immigrants | Bolivia | 98.9 /100 | #49 | Exceptional 7.7% |
| Immigrants | North Macedonia | 98.9 /100 | #50 | Exceptional 7.7% |
| Immigrants | Moldova | 98.8 /100 | #51 | Exceptional 7.7% |
| Indians (Asian) | 98.8 /100 | #52 | Exceptional 7.7% |
Demographics Similar to Aleuts by Family Poverty
In terms of family poverty, the demographic groups most similar to Aleuts are Immigrants from South America (9.5%, a difference of 0.010%), Immigrants from Lebanon (9.4%, a difference of 0.19%), German Russian (9.4%, a difference of 0.29%), Immigrants from Sierra Leone (9.4%, a difference of 0.33%), and Immigrants from Portugal (9.4%, a difference of 0.51%).
| Demographics | Rating | Rank | Family Poverty |
| Iraqis | 24.2 /100 | #198 | Fair 9.3% |
| Spaniards | 22.8 /100 | #199 | Fair 9.4% |
| Immigrants | Costa Rica | 21.7 /100 | #200 | Fair 9.4% |
| Immigrants | Portugal | 20.5 /100 | #201 | Fair 9.4% |
| Immigrants | Sierra Leone | 19.6 /100 | #202 | Poor 9.4% |
| German Russians | 19.4 /100 | #203 | Poor 9.4% |
| Immigrants | Lebanon | 18.9 /100 | #204 | Poor 9.4% |
| Aleuts | 18.0 /100 | #205 | Poor 9.5% |
| Immigrants | South America | 18.0 /100 | #206 | Poor 9.5% |
| Sierra Leoneans | 15.6 /100 | #207 | Poor 9.5% |
| Immigrants | Eastern Africa | 15.1 /100 | #208 | Poor 9.5% |
| Immigrants | Uruguay | 14.0 /100 | #209 | Poor 9.5% |
| Alsatians | 11.3 /100 | #210 | Poor 9.6% |
| Malaysians | 10.6 /100 | #211 | Poor 9.6% |
| Immigrants | Thailand | 9.7 /100 | #212 | Tragic 9.7% |