Egyptian vs Aleut Family Poverty

COMPARE

Egyptian
Race
Ancestry
AfghanAfricanAlaska NativeAlaskan AthabascanAlbanianAlsatianAmericanApacheArabArapahoArgentineanArmenianAssyrian/Chaldean/SyriacAustralianAustrianBahamianBangladeshiBarbadianBasqueBelgianBelizeanBermudanBhutaneseBlackfeetBolivianBrazilianBritishBritish West IndianBulgarianBurmeseCajunCambodianCanadianCape VerdeanCarpatho RusynCelticCentral AmericanCentral American IndianCherokeeCheyenneChickasawChileanChineseChippewaChoctawColombianColvilleComancheCosta RicanCreeCreekCroatianCrowCubanCypriotCzechCzechoslovakianDanishDelawareDominicanDutchDutch West IndianEastern EuropeanEcuadorianEgyptianEnglishEstonianEthiopianEuropeanFijianFilipinoFinnishFrenchFrench American IndianFrench CanadianGermanGerman RussianGhanaianGreekGuamanian/ChamorroGuatemalanGuyaneseHaitianHmongHonduranHopiHoumaHungarianIcelanderIndian (Asian)IndonesianInupiatIranianIraqiIrishIroquoisIsraeliItalianJamaicanJapaneseJordanianKenyanKiowaKoreanLaotianLatvianLebaneseLiberianLithuanianLumbeeLuxembourgerMacedonianMalaysianMalteseMarshalleseMenomineeMexicanMexican American IndianMongolianMoroccanNative HawaiianNavajoNepaleseNew ZealanderNicaraguanNigerianNorthern EuropeanNorwegianOkinawanOsageOttawaPaiutePakistaniPalestinianPanamanianParaguayanPennsylvania GermanPeruvianPimaPolishPortuguesePotawatomiPuebloPuerto RicanPuget Sound SalishRomanianRussianSalvadoranSamoanScandinavianScotch-IrishScottishSeminoleSenegaleseSerbianShoshoneSierra LeoneanSiouxSlavicSlovakSloveneSomaliSouth AfricanSouth AmericanSouth American IndianSoviet UnionSpaniardSpanishSpanish AmericanSpanish American IndianSri LankanSubsaharan AfricanSudaneseSwedishSwissSyrianTaiwaneseThaiTlingit-HaidaTohono O'OdhamTonganTrinidadian and TobagonianTsimshianTurkishU.S. Virgin IslanderUgandanUkrainianUruguayanUteVenezuelanVietnameseWelshWest IndianYakamaYaquiYugoslavianYumanYup'ikZimbabwean
Immigration
NonimmigrantsImmigrantsAfghanistanAfricaAlbaniaArgentinaArmeniaAsiaAustraliaAustriaBahamasBangladeshBarbadosBelarusBelgiumBelizeBoliviaBosnia and HerzegovinaBrazilBulgariaBurma/MyanmarCabo VerdeCambodiaCameroonCanadaCaribbeanCentral AmericaChileChinaColombiaCongoCosta RicaCroatiaCubaCzechoslovakiaDenmarkDominicaDominican RepublicEastern AfricaEastern AsiaEastern EuropeEcuadorEgyptEl SalvadorEnglandEritreaEthiopiaEuropeFijiFranceGermanyGhanaGreeceGrenadaGuatemalaGuyanaHaitiHondurasHong KongHungaryIndiaIndonesiaIranIraqIrelandIsraelItalyJamaicaJapanJordanKazakhstanKenyaKoreaKuwaitLaosLatin AmericaLatviaLebanonLiberiaLithuaniaMalaysiaMexicoMicronesiaMiddle AfricaMoldovaMoroccoNepalNetherlandsNicaraguaNigeriaNorth AmericaNorth MacedoniaNorthern AfricaNorthern EuropeNorwayOceaniaPakistanPanamaPeruPhilippinesPolandPortugalRomaniaRussiaSaudi ArabiaScotlandSenegalSerbiaSierra LeoneSingaporeSomaliaSouth AfricaSouth AmericaSouth Central AsiaSouth Eastern AsiaSouthern EuropeSpainSri LankaSt. Vincent and the GrenadinesSudanSwedenSwitzerlandSyriaTaiwanThailandTrinidad and TobagoTurkeyUgandaUkraineUruguayUzbekistanVenezuelaVietnamWest IndiesWestern AfricaWestern AsiaWestern EuropeYemenZaireZimbabweAzores
Aleut
Race
Ancestry
AfghanAfricanAlaska NativeAlaskan AthabascanAlbanianAleutAlsatianAmericanApacheArabArapahoArgentineanArmenianAssyrian/Chaldean/SyriacAustralianAustrianBahamianBangladeshiBarbadianBasqueBelgianBelizeanBermudanBhutaneseBlackfeetBolivianBrazilianBritishBritish West IndianBulgarianBurmeseCajunCambodianCanadianCape VerdeanCarpatho RusynCelticCentral AmericanCentral American IndianCherokeeCheyenneChickasawChileanChineseChippewaChoctawColombianColvilleComancheCosta RicanCreeCreekCroatianCrowCubanCypriotCzechCzechoslovakianDanishDelawareDominicanDutchDutch West IndianEastern EuropeanEcuadorianEnglishEstonianEthiopianEuropeanFijianFilipinoFinnishFrenchFrench American IndianFrench CanadianGermanGerman RussianGhanaianGreekGuamanian/ChamorroGuatemalanGuyaneseHaitianHmongHonduranHopiHoumaHungarianIcelanderIndian (Asian)IndonesianInupiatIranianIraqiIrishIroquoisIsraeliItalianJamaicanJapaneseJordanianKenyanKiowaKoreanLaotianLatvianLebaneseLiberianLithuanianLumbeeLuxembourgerMacedonianMalaysianMalteseMarshalleseMenomineeMexicanMexican American IndianMongolianMoroccanNative HawaiianNavajoNepaleseNew ZealanderNicaraguanNigerianNorthern EuropeanNorwegianOkinawanOsageOttawaPaiutePakistaniPalestinianPanamanianParaguayanPennsylvania GermanPeruvianPimaPolishPortuguesePotawatomiPuebloPuerto RicanPuget Sound SalishRomanianRussianSalvadoranSamoanScandinavianScotch-IrishScottishSeminoleSenegaleseSerbianShoshoneSierra LeoneanSiouxSlavicSlovakSloveneSomaliSouth AfricanSouth AmericanSouth American IndianSoviet UnionSpaniardSpanishSpanish AmericanSpanish American IndianSri LankanSubsaharan AfricanSudaneseSwedishSwissSyrianTaiwaneseThaiTlingit-HaidaTohono O'OdhamTonganTrinidadian and TobagonianTsimshianTurkishU.S. Virgin IslanderUgandanUkrainianUruguayanUteVenezuelanVietnameseWelshWest IndianYakamaYaquiYugoslavianYumanYup'ikZimbabwean
Immigration
NonimmigrantsImmigrantsAfghanistanAfricaAlbaniaArgentinaArmeniaAsiaAustraliaAustriaBahamasBangladeshBarbadosBelarusBelgiumBelizeBoliviaBosnia and HerzegovinaBrazilBulgariaBurma/MyanmarCabo VerdeCambodiaCameroonCanadaCaribbeanCentral AmericaChileChinaColombiaCongoCosta RicaCroatiaCubaCzechoslovakiaDenmarkDominicaDominican RepublicEastern AfricaEastern AsiaEastern EuropeEcuadorEgyptEl SalvadorEnglandEritreaEthiopiaEuropeFijiFranceGermanyGhanaGreeceGrenadaGuatemalaGuyanaHaitiHondurasHong KongHungaryIndiaIndonesiaIranIraqIrelandIsraelItalyJamaicaJapanJordanKazakhstanKenyaKoreaKuwaitLaosLatin AmericaLatviaLebanonLiberiaLithuaniaMalaysiaMexicoMicronesiaMiddle AfricaMoldovaMoroccoNepalNetherlandsNicaraguaNigeriaNorth AmericaNorth MacedoniaNorthern AfricaNorthern EuropeNorwayOceaniaPakistanPanamaPeruPhilippinesPolandPortugalRomaniaRussiaSaudi ArabiaScotlandSenegalSerbiaSierra LeoneSingaporeSomaliaSouth AfricaSouth AmericaSouth Central AsiaSouth Eastern AsiaSouthern EuropeSpainSri LankaSt. Vincent and the GrenadinesSudanSwedenSwitzerlandSyriaTaiwanThailandTrinidad and TobagoTurkeyUgandaUkraineUruguayUzbekistanVenezuelaVietnamWest IndiesWestern AfricaWestern AsiaWestern EuropeYemenZaireZimbabweAzores
Family Poverty
Income
Poverty
Unemployment
Labor Participation
Family Structure
Vehicle Availability
Education Level
Disability

Family Poverty Comparison

Egyptians

Aleuts

Exceptional
Poor
8.1%
FAMILY POVERTY
95.1/ 100
METRIC RATING
106th/ 347
METRIC RANK
9.5%
FAMILY POVERTY
18.0/ 100
METRIC RATING
205th/ 347
METRIC RANK

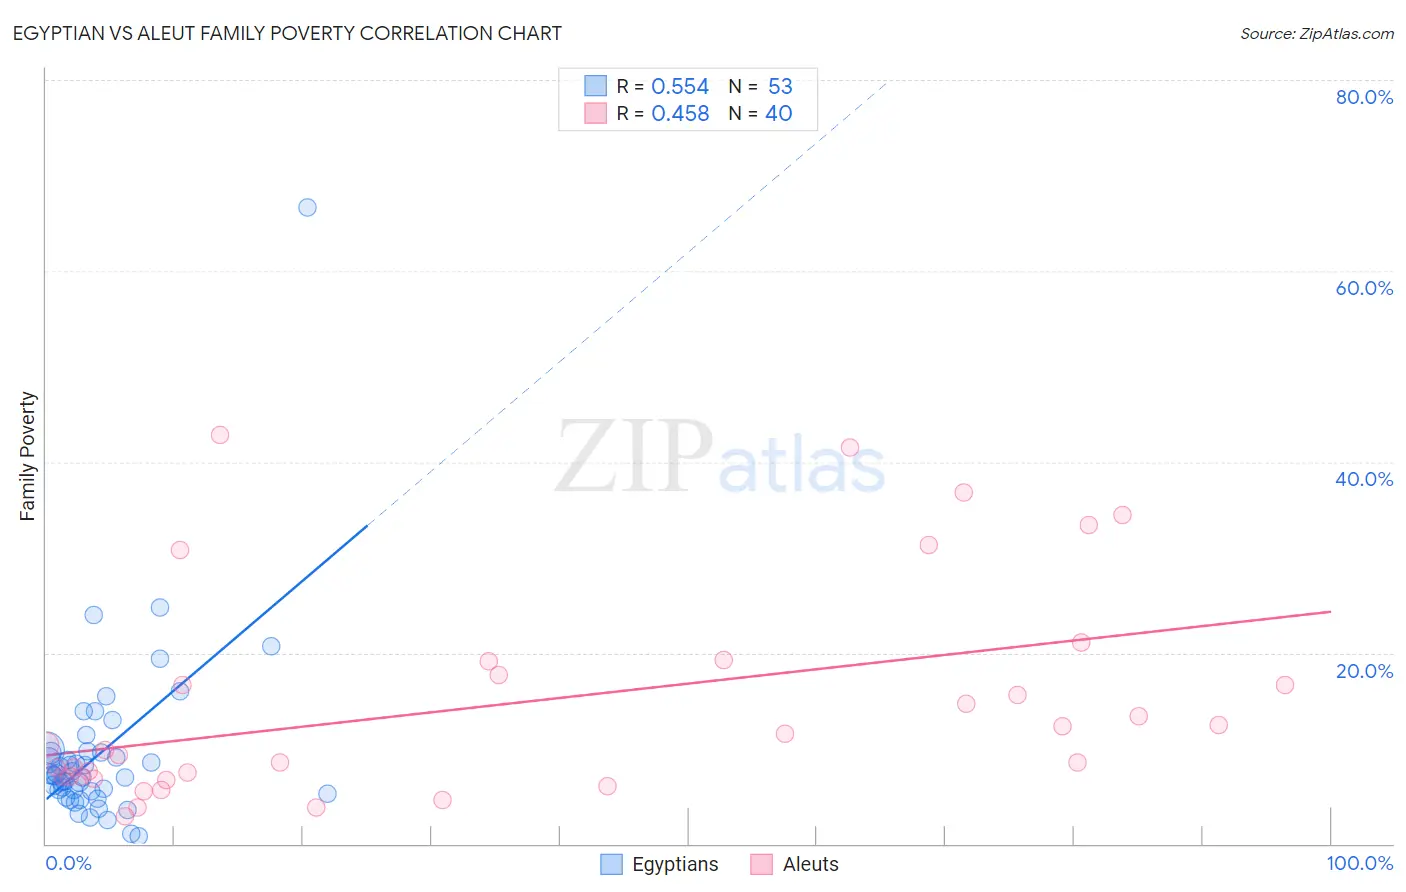
Egyptian vs Aleut Family Poverty Correlation Chart

The statistical analysis conducted on geographies consisting of 276,431,848 people shows a substantial positive correlation between the proportion of Egyptians and poverty level among families in the United States with a correlation coefficient (R) of 0.554 and weighted average of 8.1%. Similarly, the statistical analysis conducted on geographies consisting of 61,739,595 people shows a moderate positive correlation between the proportion of Aleuts and poverty level among families in the United States with a correlation coefficient (R) of 0.458 and weighted average of 9.5%, a difference of 16.2%.
Egyptian vs Aleut Family Poverty

Family Poverty Correlation Summary

MeasurementEgyptianAleut
Minimum0.78%2.9%
Maximum66.7%42.9%
Range65.9%40.0%
Mean9.5%14.6%
Median7.2%10.1%
Interquartile 25% (IQ1)5.4%7.1%
Interquartile 75% (IQ3)9.6%18.4%
Interquartile Range (IQR)4.3%11.3%
Standard Deviation (Sample)9.5%11.0%
Standard Deviation (Population)9.4%10.9%

Similar Demographics by Family Poverty

Demographics Similar to Egyptians by Family Poverty

In terms of family poverty, the demographic groups most similar to Egyptians are French Canadian (8.1%, a difference of 0.040%), Basque (8.1%, a difference of 0.13%), Jordanian (8.2%, a difference of 0.22%), Romanian (8.2%, a difference of 0.31%), and Taiwanese (8.2%, a difference of 0.36%).
DemographicsRating | RankFamily Poverty
Welsh
95.8
/100
|
#99
Exceptional
8.1%
New Zealanders
95.8
/100
|
#100
Exceptional
8.1%
Immigrants | Norway
95.7
/100
|
#101
Exceptional
8.1%
Immigrants | Indonesia
95.7
/100
|
#102
Exceptional
8.1%
Immigrants | Eastern Europe
95.6
/100
|
#103
Exceptional
8.1%
Slavs
95.6
/100
|
#104
Exceptional
8.1%
Laotians
95.6
/100
|
#105
Exceptional
8.1%
Egyptians
95.1
/100
|
#106
Exceptional
8.1%
French Canadians
95.0
/100
|
#107
Exceptional
8.1%
Basques
94.9
/100
|
#108
Exceptional
8.1%
Jordanians
94.8
/100
|
#109
Exceptional
8.2%
Romanians
94.7
/100
|
#110
Exceptional
8.2%
Taiwanese
94.6
/100
|
#111
Exceptional
8.2%
Immigrants | France
94.4
/100
|
#112
Exceptional
8.2%
Canadians
94.2
/100
|
#113
Exceptional
8.2%

Demographics Similar to Aleuts by Family Poverty

In terms of family poverty, the demographic groups most similar to Aleuts are Immigrants from South America (9.5%, a difference of 0.010%), Immigrants from Lebanon (9.4%, a difference of 0.19%), German Russian (9.4%, a difference of 0.29%), Immigrants from Sierra Leone (9.4%, a difference of 0.33%), and Immigrants from Portugal (9.4%, a difference of 0.51%).
DemographicsRating | RankFamily Poverty
Iraqis
24.2
/100
|
#198
Fair
9.3%
Spaniards
22.8
/100
|
#199
Fair
9.4%
Immigrants | Costa Rica
21.7
/100
|
#200
Fair
9.4%
Immigrants | Portugal
20.5
/100
|
#201
Fair
9.4%
Immigrants | Sierra Leone
19.6
/100
|
#202
Poor
9.4%
German Russians
19.4
/100
|
#203
Poor
9.4%
Immigrants | Lebanon
18.9
/100
|
#204
Poor
9.4%
Aleuts
18.0
/100
|
#205
Poor
9.5%
Immigrants | South America
18.0
/100
|
#206
Poor
9.5%
Sierra Leoneans
15.6
/100
|
#207
Poor
9.5%
Immigrants | Eastern Africa
15.1
/100
|
#208
Poor
9.5%
Immigrants | Uruguay
14.0
/100
|
#209
Poor
9.5%
Alsatians
11.3
/100
|
#210
Poor
9.6%
Malaysians
10.6
/100
|
#211
Poor
9.6%
Immigrants | Thailand
9.7
/100
|
#212
Tragic
9.7%