Norwegian vs Immigrants from Ukraine Single Father Poverty
COMPARE
Norwegian
Immigrants from Ukraine
Single Father Poverty
Single Father Poverty Comparison
Norwegians
Immigrants from Ukraine
15.9%
SINGLE FATHER POVERTY
90.2/ 100
METRIC RATING
130th/ 347
METRIC RANK
15.4%
SINGLE FATHER POVERTY
99.4/ 100
METRIC RATING
82nd/ 347
METRIC RANK
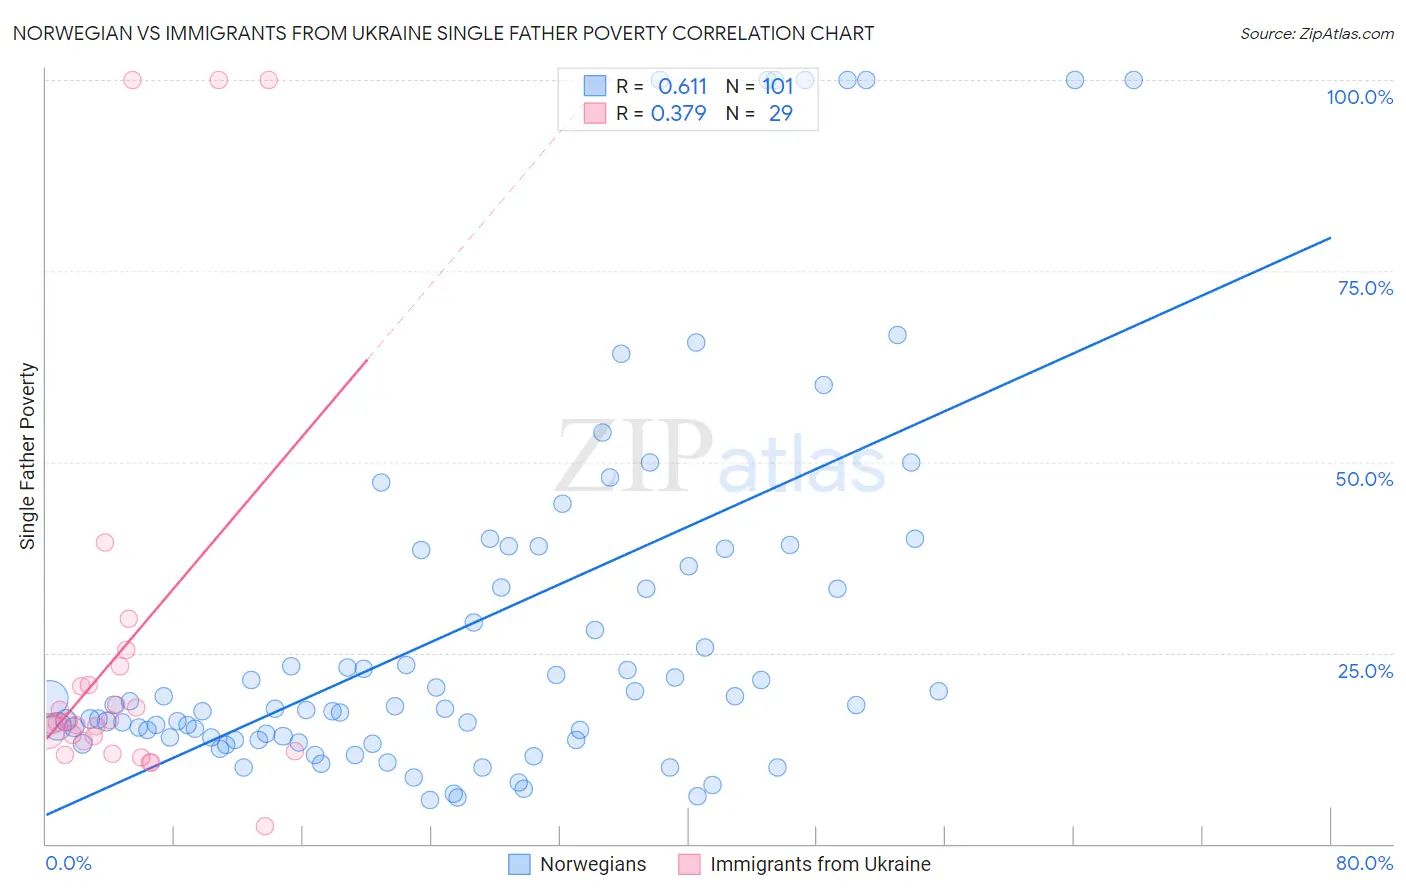
Norwegian vs Immigrants from Ukraine Single Father Poverty Correlation Chart
The statistical analysis conducted on geographies consisting of 388,337,291 people shows a significant positive correlation between the proportion of Norwegians and poverty level among single fathers in the United States with a correlation coefficient (R) of 0.611 and weighted average of 15.9%. Similarly, the statistical analysis conducted on geographies consisting of 230,818,529 people shows a mild positive correlation between the proportion of Immigrants from Ukraine and poverty level among single fathers in the United States with a correlation coefficient (R) of 0.379 and weighted average of 15.4%, a difference of 3.3%.
Single Father Poverty Correlation Summary
| Measurement | Norwegian | Immigrants from Ukraine |
| Minimum | 5.8% | 2.4% |
| Maximum | 100.0% | 100.0% |
| Range | 94.2% | 97.6% |
| Mean | 28.6% | 25.3% |
| Median | 17.9% | 15.9% |
| Interquartile 25% (IQ1) | 13.8% | 12.7% |
| Interquartile 75% (IQ3) | 37.4% | 22.0% |
| Interquartile Range (IQR) | 23.6% | 9.3% |
| Standard Deviation (Sample) | 25.1% | 26.7% |
| Standard Deviation (Population) | 25.0% | 26.2% |
Similar Demographics by Single Father Poverty
Demographics Similar to Norwegians by Single Father Poverty
In terms of single father poverty, the demographic groups most similar to Norwegians are Nicaraguan (15.9%, a difference of 0.0%), Immigrants from Portugal (15.9%, a difference of 0.060%), Immigrants from Nigeria (15.9%, a difference of 0.080%), Immigrants from West Indies (15.9%, a difference of 0.080%), and Immigrants from Syria (15.9%, a difference of 0.080%).
| Demographics | Rating | Rank | Single Father Poverty |
| Palestinians | 91.3 /100 | #123 | Exceptional 15.9% |
| Immigrants | Panama | 91.3 /100 | #124 | Exceptional 15.9% |
| Iraqis | 91.2 /100 | #125 | Exceptional 15.9% |
| Hmong | 91.1 /100 | #126 | Exceptional 15.9% |
| Immigrants | Liberia | 91.1 /100 | #127 | Exceptional 15.9% |
| Immigrants | Nigeria | 90.8 /100 | #128 | Exceptional 15.9% |
| Immigrants | West Indies | 90.8 /100 | #129 | Exceptional 15.9% |
| Norwegians | 90.2 /100 | #130 | Exceptional 15.9% |
| Nicaraguans | 90.1 /100 | #131 | Exceptional 15.9% |
| Immigrants | Portugal | 89.7 /100 | #132 | Excellent 15.9% |
| Immigrants | Syria | 89.5 /100 | #133 | Excellent 15.9% |
| Immigrants | South America | 88.5 /100 | #134 | Excellent 15.9% |
| Immigrants | Sri Lanka | 88.2 /100 | #135 | Excellent 15.9% |
| Cypriots | 87.5 /100 | #136 | Excellent 15.9% |
| Immigrants | Azores | 87.2 /100 | #137 | Excellent 15.9% |
Demographics Similar to Immigrants from Ukraine by Single Father Poverty
In terms of single father poverty, the demographic groups most similar to Immigrants from Ukraine are Immigrants from Congo (15.4%, a difference of 0.010%), Armenian (15.4%, a difference of 0.030%), Chinese (15.4%, a difference of 0.090%), Peruvian (15.4%, a difference of 0.22%), and Immigrants from Northern Africa (15.3%, a difference of 0.26%).
| Demographics | Rating | Rank | Single Father Poverty |
| Immigrants | Turkey | 99.5 /100 | #75 | Exceptional 15.3% |
| Immigrants | Japan | 99.5 /100 | #76 | Exceptional 15.3% |
| Immigrants | Peru | 99.5 /100 | #77 | Exceptional 15.3% |
| Tlingit-Haida | 99.5 /100 | #78 | Exceptional 15.3% |
| Immigrants | Northern Africa | 99.5 /100 | #79 | Exceptional 15.3% |
| Armenians | 99.4 /100 | #80 | Exceptional 15.4% |
| Immigrants | Congo | 99.4 /100 | #81 | Exceptional 15.4% |
| Immigrants | Ukraine | 99.4 /100 | #82 | Exceptional 15.4% |
| Chinese | 99.3 /100 | #83 | Exceptional 15.4% |
| Peruvians | 99.2 /100 | #84 | Exceptional 15.4% |
| Immigrants | Oceania | 99.1 /100 | #85 | Exceptional 15.4% |
| Immigrants | Russia | 99.0 /100 | #86 | Exceptional 15.5% |
| Brazilians | 99.0 /100 | #87 | Exceptional 15.5% |
| Burmese | 99.0 /100 | #88 | Exceptional 15.5% |
| Immigrants | Korea | 99.0 /100 | #89 | Exceptional 15.5% |