Immigrants from Zaire vs Immigrants from Ukraine Single Father Poverty
COMPARE
Immigrants from Zaire
Immigrants from Ukraine
Single Father Poverty
Single Father Poverty Comparison
Immigrants from Zaire
Immigrants from Ukraine
17.3%
SINGLE FATHER POVERTY
0.4/ 100
METRIC RATING
262nd/ 347
METRIC RANK
15.4%
SINGLE FATHER POVERTY
99.4/ 100
METRIC RATING
82nd/ 347
METRIC RANK
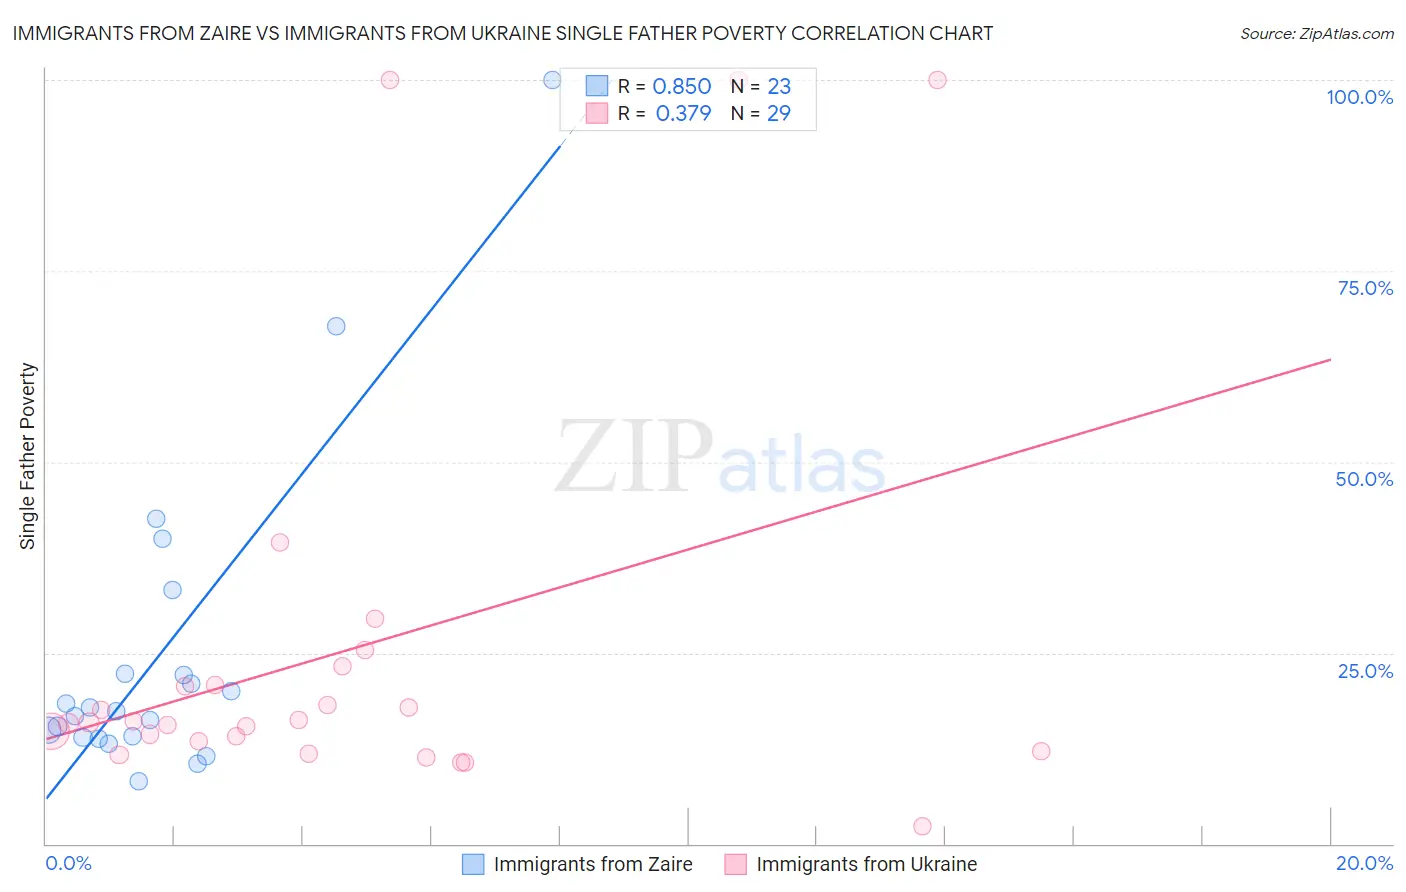
Immigrants from Zaire vs Immigrants from Ukraine Single Father Poverty Correlation Chart
The statistical analysis conducted on geographies consisting of 97,955,340 people shows a very strong positive correlation between the proportion of Immigrants from Zaire and poverty level among single fathers in the United States with a correlation coefficient (R) of 0.850 and weighted average of 17.3%. Similarly, the statistical analysis conducted on geographies consisting of 230,818,529 people shows a mild positive correlation between the proportion of Immigrants from Ukraine and poverty level among single fathers in the United States with a correlation coefficient (R) of 0.379 and weighted average of 15.4%, a difference of 12.3%.
Single Father Poverty Correlation Summary
| Measurement | Immigrants from Zaire | Immigrants from Ukraine |
| Minimum | 8.2% | 2.4% |
| Maximum | 100.0% | 100.0% |
| Range | 91.8% | 97.6% |
| Mean | 24.8% | 25.3% |
| Median | 17.3% | 15.9% |
| Interquartile 25% (IQ1) | 14.0% | 12.7% |
| Interquartile 75% (IQ3) | 22.3% | 22.0% |
| Interquartile Range (IQR) | 8.3% | 9.3% |
| Standard Deviation (Sample) | 21.1% | 26.7% |
| Standard Deviation (Population) | 20.6% | 26.2% |
Similar Demographics by Single Father Poverty
Demographics Similar to Immigrants from Zaire by Single Father Poverty
In terms of single father poverty, the demographic groups most similar to Immigrants from Zaire are Lithuanian (17.3%, a difference of 0.010%), Swiss (17.3%, a difference of 0.13%), Slovene (17.3%, a difference of 0.22%), Polish (17.3%, a difference of 0.22%), and Jamaican (17.3%, a difference of 0.27%).
| Demographics | Rating | Rank | Single Father Poverty |
| Sierra Leoneans | 0.8 /100 | #255 | Tragic 17.2% |
| Immigrants | Haiti | 0.8 /100 | #256 | Tragic 17.2% |
| Immigrants | Albania | 0.7 /100 | #257 | Tragic 17.2% |
| Albanians | 0.7 /100 | #258 | Tragic 17.2% |
| Immigrants | Jamaica | 0.7 /100 | #259 | Tragic 17.2% |
| Spaniards | 0.6 /100 | #260 | Tragic 17.2% |
| Swiss | 0.5 /100 | #261 | Tragic 17.3% |
| Immigrants | Zaire | 0.4 /100 | #262 | Tragic 17.3% |
| Lithuanians | 0.4 /100 | #263 | Tragic 17.3% |
| Slovenes | 0.3 /100 | #264 | Tragic 17.3% |
| Poles | 0.3 /100 | #265 | Tragic 17.3% |
| Jamaicans | 0.3 /100 | #266 | Tragic 17.3% |
| Haitians | 0.3 /100 | #267 | Tragic 17.3% |
| Immigrants | Caribbean | 0.3 /100 | #268 | Tragic 17.4% |
| Slavs | 0.3 /100 | #269 | Tragic 17.4% |
Demographics Similar to Immigrants from Ukraine by Single Father Poverty
In terms of single father poverty, the demographic groups most similar to Immigrants from Ukraine are Immigrants from Congo (15.4%, a difference of 0.010%), Armenian (15.4%, a difference of 0.030%), Chinese (15.4%, a difference of 0.090%), Peruvian (15.4%, a difference of 0.22%), and Immigrants from Northern Africa (15.3%, a difference of 0.26%).
| Demographics | Rating | Rank | Single Father Poverty |
| Immigrants | Turkey | 99.5 /100 | #75 | Exceptional 15.3% |
| Immigrants | Japan | 99.5 /100 | #76 | Exceptional 15.3% |
| Immigrants | Peru | 99.5 /100 | #77 | Exceptional 15.3% |
| Tlingit-Haida | 99.5 /100 | #78 | Exceptional 15.3% |
| Immigrants | Northern Africa | 99.5 /100 | #79 | Exceptional 15.3% |
| Armenians | 99.4 /100 | #80 | Exceptional 15.4% |
| Immigrants | Congo | 99.4 /100 | #81 | Exceptional 15.4% |
| Immigrants | Ukraine | 99.4 /100 | #82 | Exceptional 15.4% |
| Chinese | 99.3 /100 | #83 | Exceptional 15.4% |
| Peruvians | 99.2 /100 | #84 | Exceptional 15.4% |
| Immigrants | Oceania | 99.1 /100 | #85 | Exceptional 15.4% |
| Immigrants | Russia | 99.0 /100 | #86 | Exceptional 15.5% |
| Brazilians | 99.0 /100 | #87 | Exceptional 15.5% |
| Burmese | 99.0 /100 | #88 | Exceptional 15.5% |
| Immigrants | Korea | 99.0 /100 | #89 | Exceptional 15.5% |