Norwegian vs Immigrants from Thailand Seniors Poverty Over the Age of 75
COMPARE
Norwegian
Immigrants from Thailand
Seniors Poverty Over the Age of 75
Seniors Poverty Over the Age of 75 Comparison
Norwegians
Immigrants from Thailand
10.2%
SENIORS POVERTY OVER THE AGE OF 75
100.0/ 100
METRIC RATING
5th/ 347
METRIC RANK
12.2%
SENIORS POVERTY OVER THE AGE OF 75
52.0/ 100
METRIC RATING
170th/ 347
METRIC RANK
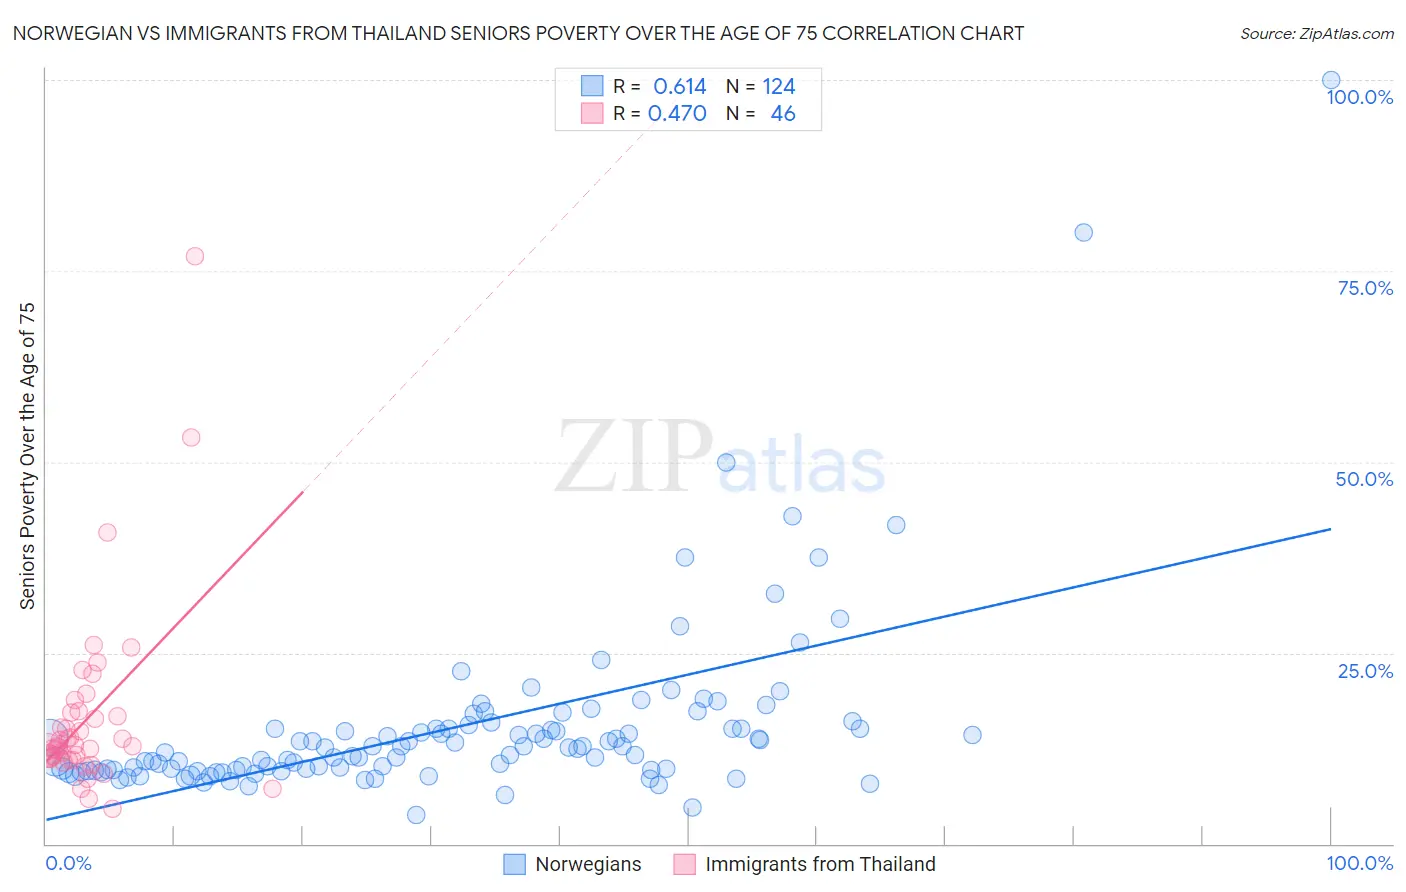
Norwegian vs Immigrants from Thailand Seniors Poverty Over the Age of 75 Correlation Chart
The statistical analysis conducted on geographies consisting of 520,068,744 people shows a significant positive correlation between the proportion of Norwegians and poverty level among seniors over the age of 75 in the United States with a correlation coefficient (R) of 0.614 and weighted average of 10.2%. Similarly, the statistical analysis conducted on geographies consisting of 314,343,906 people shows a moderate positive correlation between the proportion of Immigrants from Thailand and poverty level among seniors over the age of 75 in the United States with a correlation coefficient (R) of 0.470 and weighted average of 12.2%, a difference of 19.3%.
Seniors Poverty Over the Age of 75 Correlation Summary
| Measurement | Norwegian | Immigrants from Thailand |
| Minimum | 3.8% | 4.5% |
| Maximum | 100.0% | 76.9% |
| Range | 96.2% | 72.4% |
| Mean | 15.3% | 16.6% |
| Median | 12.5% | 12.8% |
| Interquartile 25% (IQ1) | 9.6% | 11.2% |
| Interquartile 75% (IQ3) | 15.1% | 17.2% |
| Interquartile Range (IQR) | 5.4% | 6.1% |
| Standard Deviation (Sample) | 12.2% | 12.4% |
| Standard Deviation (Population) | 12.2% | 12.3% |
Similar Demographics by Seniors Poverty Over the Age of 75
Demographics Similar to Norwegians by Seniors Poverty Over the Age of 75
In terms of seniors poverty over the age of 75, the demographic groups most similar to Norwegians are Danish (10.2%, a difference of 0.27%), Swedish (10.2%, a difference of 0.40%), Maltese (10.3%, a difference of 0.92%), Native Hawaiian (10.1%, a difference of 1.3%), and German (10.4%, a difference of 1.5%).
| Demographics | Rating | Rank | Seniors Poverty Over the Age of 75 |
| Chinese | 100.0 /100 | #1 | Exceptional 9.1% |
| Tlingit-Haida | 100.0 /100 | #2 | Exceptional 9.7% |
| Native Hawaiians | 100.0 /100 | #3 | Exceptional 10.1% |
| Swedes | 100.0 /100 | #4 | Exceptional 10.2% |
| Norwegians | 100.0 /100 | #5 | Exceptional 10.2% |
| Danes | 100.0 /100 | #6 | Exceptional 10.2% |
| Maltese | 100.0 /100 | #7 | Exceptional 10.3% |
| Germans | 99.9 /100 | #8 | Exceptional 10.4% |
| English | 99.9 /100 | #9 | Exceptional 10.4% |
| Scandinavians | 99.9 /100 | #10 | Exceptional 10.4% |
| Immigrants | India | 99.9 /100 | #11 | Exceptional 10.4% |
| Tongans | 99.9 /100 | #12 | Exceptional 10.5% |
| Croatians | 99.9 /100 | #13 | Exceptional 10.5% |
| Scottish | 99.9 /100 | #14 | Exceptional 10.5% |
| Europeans | 99.9 /100 | #15 | Exceptional 10.5% |
Demographics Similar to Immigrants from Thailand by Seniors Poverty Over the Age of 75
In terms of seniors poverty over the age of 75, the demographic groups most similar to Immigrants from Thailand are Spaniard (12.2%, a difference of 0.030%), Immigrants from Fiji (12.2%, a difference of 0.040%), Arab (12.2%, a difference of 0.13%), Immigrants from Egypt (12.2%, a difference of 0.14%), and Immigrants from Syria (12.2%, a difference of 0.15%).
| Demographics | Rating | Rank | Seniors Poverty Over the Age of 75 |
| Immigrants | Greece | 58.2 /100 | #163 | Average 12.1% |
| Potawatomi | 57.4 /100 | #164 | Average 12.1% |
| Okinawans | 56.3 /100 | #165 | Average 12.1% |
| Egyptians | 54.8 /100 | #166 | Average 12.1% |
| Immigrants | Switzerland | 54.5 /100 | #167 | Average 12.1% |
| Immigrants | Syria | 53.9 /100 | #168 | Average 12.2% |
| Immigrants | Egypt | 53.7 /100 | #169 | Average 12.2% |
| Immigrants | Thailand | 52.0 /100 | #170 | Average 12.2% |
| Spaniards | 51.6 /100 | #171 | Average 12.2% |
| Immigrants | Fiji | 51.5 /100 | #172 | Average 12.2% |
| Arabs | 50.5 /100 | #173 | Average 12.2% |
| Immigrants | Europe | 50.0 /100 | #174 | Average 12.2% |
| Immigrants | Saudi Arabia | 49.5 /100 | #175 | Average 12.2% |
| Immigrants | Iran | 48.1 /100 | #176 | Average 12.2% |
| Immigrants | Asia | 47.8 /100 | #177 | Average 12.2% |