Norwegian vs Immigrants from Thailand Per Capita Income
COMPARE
Norwegian
Immigrants from Thailand
Per Capita Income
Per Capita Income Comparison
Norwegians
Immigrants from Thailand
$44,480
PER CAPITA INCOME
71.5/ 100
METRIC RATING
151st/ 347
METRIC RANK
$42,289
PER CAPITA INCOME
17.6/ 100
METRIC RATING
201st/ 347
METRIC RANK
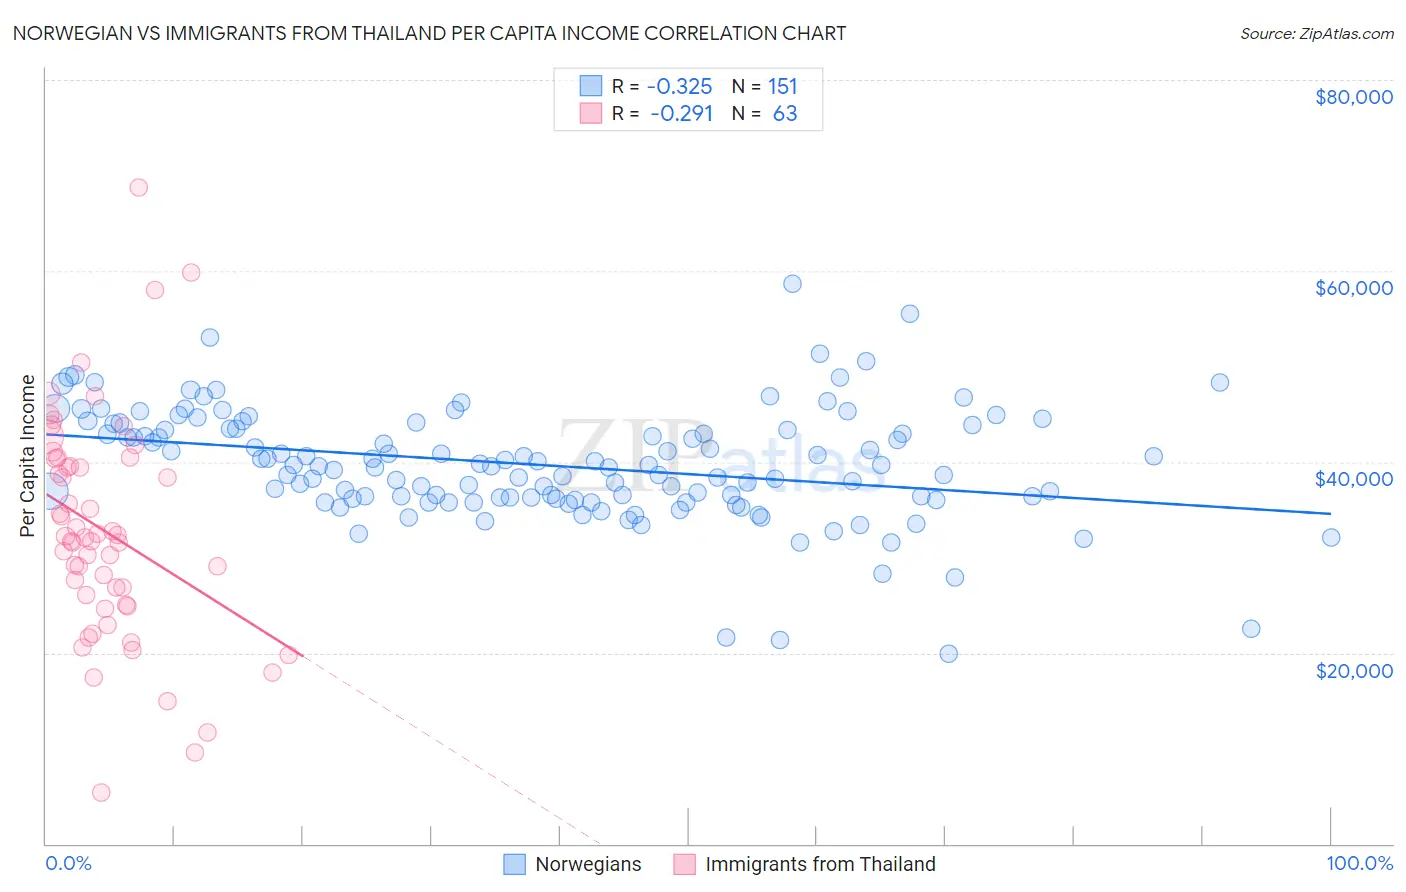
Norwegian vs Immigrants from Thailand Per Capita Income Correlation Chart
The statistical analysis conducted on geographies consisting of 533,432,025 people shows a mild negative correlation between the proportion of Norwegians and per capita income in the United States with a correlation coefficient (R) of -0.325 and weighted average of $44,480. Similarly, the statistical analysis conducted on geographies consisting of 317,026,349 people shows a weak negative correlation between the proportion of Immigrants from Thailand and per capita income in the United States with a correlation coefficient (R) of -0.291 and weighted average of $42,289, a difference of 5.2%.
Per Capita Income Correlation Summary
| Measurement | Norwegian | Immigrants from Thailand |
| Minimum | $19,862 | $5,324 |
| Maximum | $58,625 | $68,712 |
| Range | $38,763 | $63,388 |
| Mean | $39,667 | $32,742 |
| Median | $39,585 | $32,020 |
| Interquartile 25% (IQ1) | $36,106 | $24,989 |
| Interquartile 75% (IQ3) | $43,454 | $40,306 |
| Interquartile Range (IQR) | $7,348 | $15,317 |
| Standard Deviation (Sample) | $5,967 | $11,676 |
| Standard Deviation (Population) | $5,947 | $11,583 |
Similar Demographics by Per Capita Income
Demographics Similar to Norwegians by Per Capita Income
In terms of per capita income, the demographic groups most similar to Norwegians are Peruvian ($44,479, a difference of 0.0%), Immigrants from Eritrea ($44,509, a difference of 0.060%), Scottish ($44,440, a difference of 0.090%), Korean ($44,522, a difference of 0.10%), and Immigrants from Armenia ($44,552, a difference of 0.16%).
| Demographics | Rating | Rank | Per Capita Income |
| Icelanders | 81.6 /100 | #144 | Excellent $44,987 |
| Immigrants | Afghanistan | 78.0 /100 | #145 | Good $44,790 |
| Irish | 75.8 /100 | #146 | Good $44,679 |
| Czechs | 74.1 /100 | #147 | Good $44,595 |
| Immigrants | Armenia | 73.1 /100 | #148 | Good $44,552 |
| Koreans | 72.5 /100 | #149 | Good $44,522 |
| Immigrants | Eritrea | 72.1 /100 | #150 | Good $44,509 |
| Norwegians | 71.5 /100 | #151 | Good $44,480 |
| Peruvians | 71.5 /100 | #152 | Good $44,479 |
| Scottish | 70.6 /100 | #153 | Good $44,440 |
| Portuguese | 68.7 /100 | #154 | Good $44,362 |
| Uruguayans | 67.6 /100 | #155 | Good $44,318 |
| Slovaks | 65.4 /100 | #156 | Good $44,229 |
| South American Indians | 64.8 /100 | #157 | Good $44,206 |
| Immigrants | Nepal | 64.3 /100 | #158 | Good $44,187 |
Demographics Similar to Immigrants from Thailand by Per Capita Income
In terms of per capita income, the demographic groups most similar to Immigrants from Thailand are Immigrants from Bosnia and Herzegovina ($42,278, a difference of 0.030%), Spanish ($42,249, a difference of 0.090%), Vietnamese ($42,368, a difference of 0.19%), Aleut ($42,210, a difference of 0.19%), and White/Caucasian ($42,180, a difference of 0.26%).
| Demographics | Rating | Rank | Per Capita Income |
| Immigrants | Fiji | 25.2 /100 | #194 | Fair $42,694 |
| Immigrants | Kenya | 24.5 /100 | #195 | Fair $42,661 |
| Dutch | 23.4 /100 | #196 | Fair $42,605 |
| Scotch-Irish | 22.6 /100 | #197 | Fair $42,563 |
| Immigrants | Portugal | 19.7 /100 | #198 | Poor $42,412 |
| Barbadians | 19.6 /100 | #199 | Poor $42,406 |
| Vietnamese | 19.0 /100 | #200 | Poor $42,368 |
| Immigrants | Thailand | 17.6 /100 | #201 | Poor $42,289 |
| Immigrants | Bosnia and Herzegovina | 17.5 /100 | #202 | Poor $42,278 |
| Spanish | 17.0 /100 | #203 | Poor $42,249 |
| Aleuts | 16.4 /100 | #204 | Poor $42,210 |
| Whites/Caucasians | 15.9 /100 | #205 | Poor $42,180 |
| Ghanaians | 15.7 /100 | #206 | Poor $42,164 |
| Venezuelans | 14.4 /100 | #207 | Poor $42,074 |
| Panamanians | 13.9 /100 | #208 | Poor $42,035 |