Northern European vs Immigrants from Uganda Single Female Poverty
COMPARE
Northern European
Immigrants from Uganda
Single Female Poverty
Single Female Poverty Comparison
Northern Europeans
Immigrants from Uganda
20.8%
SINGLE FEMALE POVERTY
68.4/ 100
METRIC RATING
162nd/ 347
METRIC RANK
20.3%
SINGLE FEMALE POVERTY
89.1/ 100
METRIC RATING
142nd/ 347
METRIC RANK
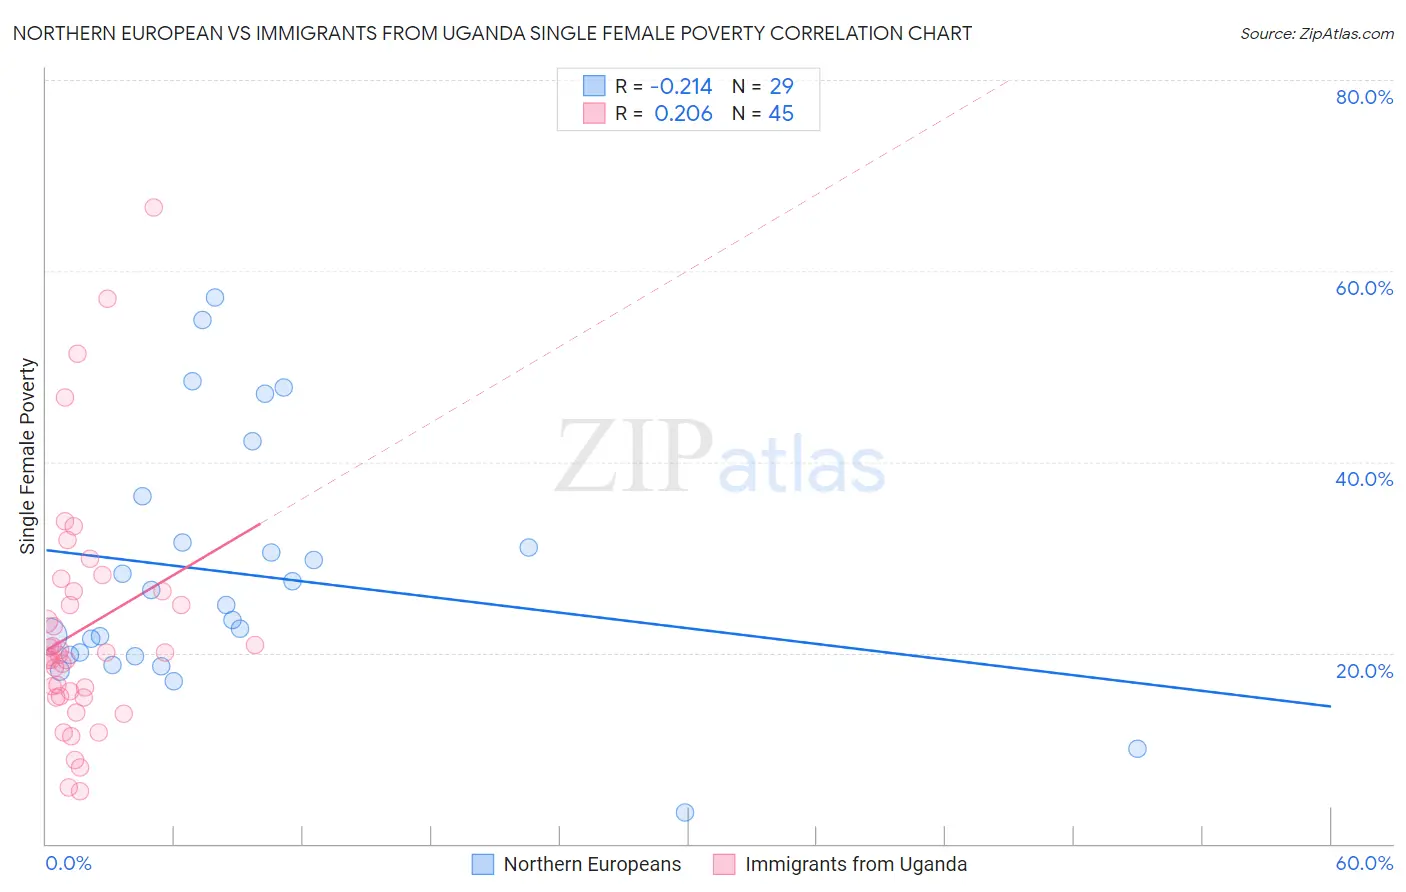
Northern European vs Immigrants from Uganda Single Female Poverty Correlation Chart
The statistical analysis conducted on geographies consisting of 398,261,787 people shows a weak negative correlation between the proportion of Northern Europeans and poverty level among single females in the United States with a correlation coefficient (R) of -0.214 and weighted average of 20.8%. Similarly, the statistical analysis conducted on geographies consisting of 125,509,533 people shows a weak positive correlation between the proportion of Immigrants from Uganda and poverty level among single females in the United States with a correlation coefficient (R) of 0.206 and weighted average of 20.3%, a difference of 2.1%.
Single Female Poverty Correlation Summary
| Measurement | Northern European | Immigrants from Uganda |
| Minimum | 3.3% | 5.5% |
| Maximum | 57.3% | 66.7% |
| Range | 54.0% | 61.2% |
| Mean | 28.3% | 22.5% |
| Median | 25.0% | 19.7% |
| Interquartile 25% (IQ1) | 19.7% | 15.4% |
| Interquartile 75% (IQ3) | 34.0% | 26.5% |
| Interquartile Range (IQR) | 14.3% | 11.1% |
| Standard Deviation (Sample) | 13.0% | 12.6% |
| Standard Deviation (Population) | 12.8% | 12.4% |
Demographics Similar to Northern Europeans and Immigrants from Uganda by Single Female Poverty
In terms of single female poverty, the demographic groups most similar to Northern Europeans are Kenyan (20.8%, a difference of 0.010%), Arab (20.7%, a difference of 0.18%), Costa Rican (20.7%, a difference of 0.26%), Danish (20.7%, a difference of 0.35%), and Immigrants from Oceania (20.7%, a difference of 0.46%). Similarly, the demographic groups most similar to Immigrants from Uganda are Australian (20.3%, a difference of 0.12%), Immigrants from Uzbekistan (20.3%, a difference of 0.13%), Austrian (20.4%, a difference of 0.49%), Venezuelan (20.4%, a difference of 0.52%), and South African (20.4%, a difference of 0.55%).
| Demographics | Rating | Rank | Single Female Poverty |
| Immigrants | Uganda | 89.1 /100 | #142 | Excellent 20.3% |
| Australians | 88.4 /100 | #143 | Excellent 20.3% |
| Immigrants | Uzbekistan | 88.3 /100 | #144 | Excellent 20.3% |
| Austrians | 85.8 /100 | #145 | Excellent 20.4% |
| Venezuelans | 85.5 /100 | #146 | Excellent 20.4% |
| South Africans | 85.3 /100 | #147 | Excellent 20.4% |
| Luxembourgers | 84.9 /100 | #148 | Excellent 20.4% |
| Portuguese | 81.5 /100 | #149 | Excellent 20.5% |
| Immigrants | Denmark | 80.5 /100 | #150 | Excellent 20.5% |
| Puget Sound Salish | 79.6 /100 | #151 | Good 20.6% |
| Immigrants | Uruguay | 77.7 /100 | #152 | Good 20.6% |
| Swedes | 77.1 /100 | #153 | Good 20.6% |
| Immigrants | Western Europe | 76.7 /100 | #154 | Good 20.6% |
| Samoans | 76.0 /100 | #155 | Good 20.6% |
| South American Indians | 75.7 /100 | #156 | Good 20.6% |
| Immigrants | Oceania | 74.3 /100 | #157 | Good 20.7% |
| Danes | 73.0 /100 | #158 | Good 20.7% |
| Costa Ricans | 71.8 /100 | #159 | Good 20.7% |
| Arabs | 70.8 /100 | #160 | Good 20.7% |
| Kenyans | 68.5 /100 | #161 | Good 20.8% |
| Northern Europeans | 68.4 /100 | #162 | Good 20.8% |