Nicaraguan vs Albanian Family Poverty
COMPARE
Nicaraguan
Albanian
Family Poverty
Family Poverty Comparison
Nicaraguans
Albanians
10.6%
FAMILY POVERTY
0.4/ 100
METRIC RATING
248th/ 347
METRIC RANK
8.5%
FAMILY POVERTY
83.3/ 100
METRIC RATING
144th/ 347
METRIC RANK
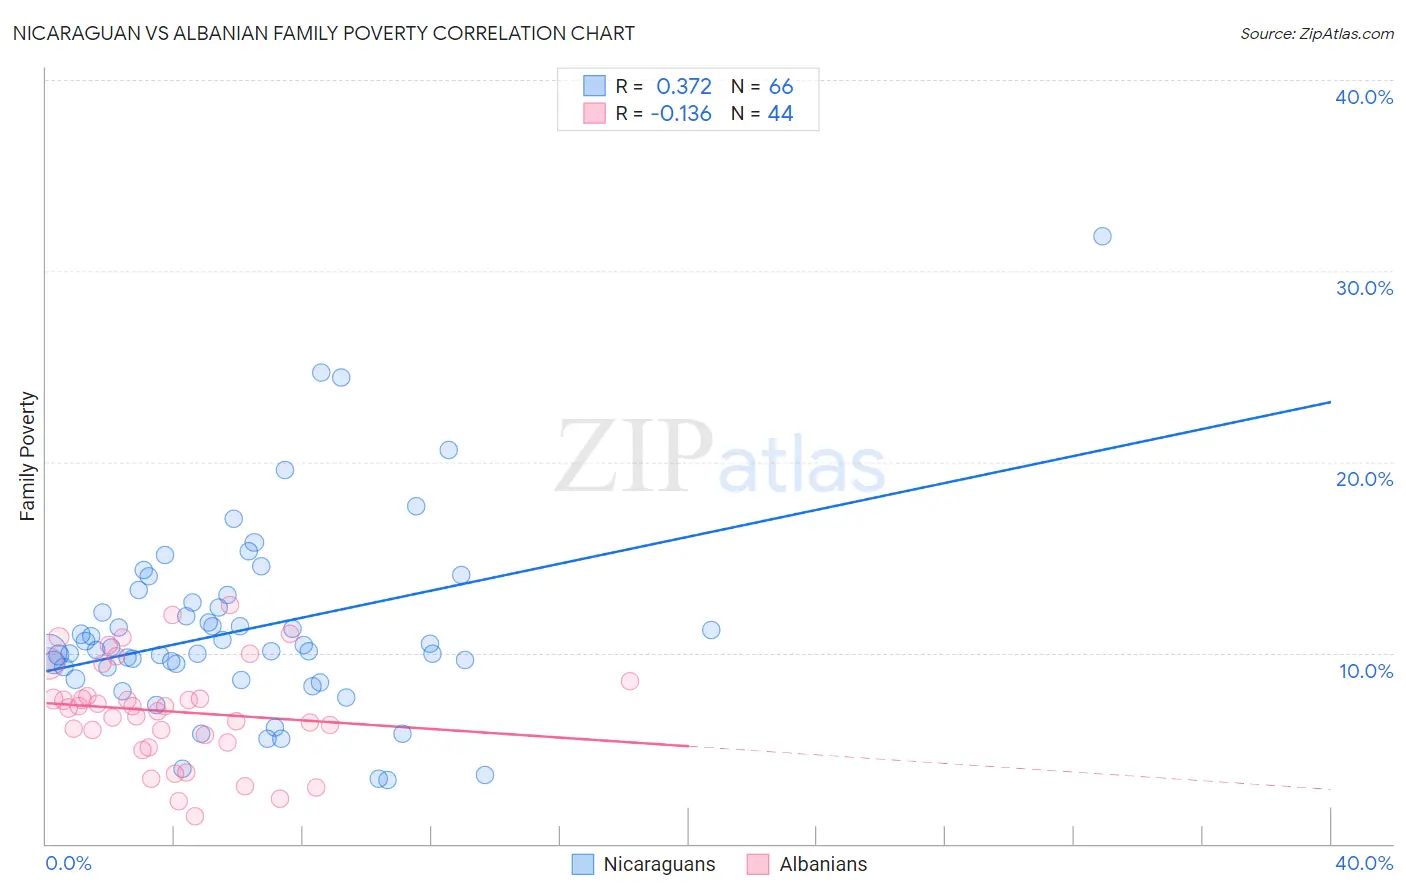
Nicaraguan vs Albanian Family Poverty Correlation Chart
The statistical analysis conducted on geographies consisting of 285,444,498 people shows a mild positive correlation between the proportion of Nicaraguans and poverty level among families in the United States with a correlation coefficient (R) of 0.372 and weighted average of 10.6%. Similarly, the statistical analysis conducted on geographies consisting of 192,873,103 people shows a poor negative correlation between the proportion of Albanians and poverty level among families in the United States with a correlation coefficient (R) of -0.136 and weighted average of 8.5%, a difference of 24.5%.
Family Poverty Correlation Summary
| Measurement | Nicaraguan | Albanian |
| Minimum | 3.3% | 1.4% |
| Maximum | 31.8% | 12.5% |
| Range | 28.5% | 11.1% |
| Mean | 11.2% | 6.9% |
| Median | 10.2% | 7.1% |
| Interquartile 25% (IQ1) | 9.2% | 5.5% |
| Interquartile 75% (IQ3) | 12.6% | 8.1% |
| Interquartile Range (IQR) | 3.4% | 2.6% |
| Standard Deviation (Sample) | 5.0% | 2.7% |
| Standard Deviation (Population) | 4.9% | 2.6% |
Similar Demographics by Family Poverty
Demographics Similar to Nicaraguans by Family Poverty
In terms of family poverty, the demographic groups most similar to Nicaraguans are Cuban (10.6%, a difference of 0.050%), Liberian (10.6%, a difference of 0.20%), Cherokee (10.6%, a difference of 0.29%), Salvadoran (10.7%, a difference of 0.57%), and Iroquois (10.7%, a difference of 0.86%).
| Demographics | Rating | Rank | Family Poverty |
| Ghanaians | 1.3 /100 | #241 | Tragic 10.3% |
| Alaska Natives | 1.0 /100 | #242 | Tragic 10.4% |
| Nepalese | 0.8 /100 | #243 | Tragic 10.4% |
| Cree | 0.7 /100 | #244 | Tragic 10.5% |
| Immigrants | Burma/Myanmar | 0.6 /100 | #245 | Tragic 10.5% |
| Cherokee | 0.5 /100 | #246 | Tragic 10.6% |
| Liberians | 0.4 /100 | #247 | Tragic 10.6% |
| Nicaraguans | 0.4 /100 | #248 | Tragic 10.6% |
| Cubans | 0.4 /100 | #249 | Tragic 10.6% |
| Salvadorans | 0.3 /100 | #250 | Tragic 10.7% |
| Iroquois | 0.3 /100 | #251 | Tragic 10.7% |
| Immigrants | Zaire | 0.3 /100 | #252 | Tragic 10.7% |
| Immigrants | Western Africa | 0.3 /100 | #253 | Tragic 10.7% |
| Ecuadorians | 0.2 /100 | #254 | Tragic 10.8% |
| Immigrants | Liberia | 0.2 /100 | #255 | Tragic 10.8% |
Demographics Similar to Albanians by Family Poverty
In terms of family poverty, the demographic groups most similar to Albanians are Immigrants from Germany (8.5%, a difference of 0.020%), Immigrants from South Eastern Asia (8.5%, a difference of 0.020%), Immigrants from Belarus (8.5%, a difference of 0.030%), Yugoslavian (8.5%, a difference of 0.050%), and Immigrants from Jordan (8.5%, a difference of 0.060%).
| Demographics | Rating | Rank | Family Poverty |
| Immigrants | Southern Europe | 86.0 /100 | #137 | Excellent 8.5% |
| Armenians | 84.6 /100 | #138 | Excellent 8.5% |
| Immigrants | Nepal | 84.2 /100 | #139 | Excellent 8.5% |
| Immigrants | Kazakhstan | 84.1 /100 | #140 | Excellent 8.5% |
| Immigrants | Ukraine | 83.9 /100 | #141 | Excellent 8.5% |
| Yugoslavians | 83.5 /100 | #142 | Excellent 8.5% |
| Immigrants | Germany | 83.3 /100 | #143 | Excellent 8.5% |
| Albanians | 83.3 /100 | #144 | Excellent 8.5% |
| Immigrants | South Eastern Asia | 83.2 /100 | #145 | Excellent 8.5% |
| Immigrants | Belarus | 83.2 /100 | #146 | Excellent 8.5% |
| Immigrants | Jordan | 83.0 /100 | #147 | Excellent 8.5% |
| Scotch-Irish | 82.2 /100 | #148 | Excellent 8.6% |
| Mongolians | 80.4 /100 | #149 | Excellent 8.6% |
| Syrians | 80.3 /100 | #150 | Excellent 8.6% |
| Brazilians | 80.1 /100 | #151 | Excellent 8.6% |