Nicaraguan vs Albanian Doctorate Degree
COMPARE
Nicaraguan
Albanian
Doctorate Degree
Doctorate Degree Comparison
Nicaraguans
Albanians
1.5%
DOCTORATE DEGREE
0.6/ 100
METRIC RATING
265th/ 347
METRIC RANK
1.9%
DOCTORATE DEGREE
74.8/ 100
METRIC RATING
151st/ 347
METRIC RANK
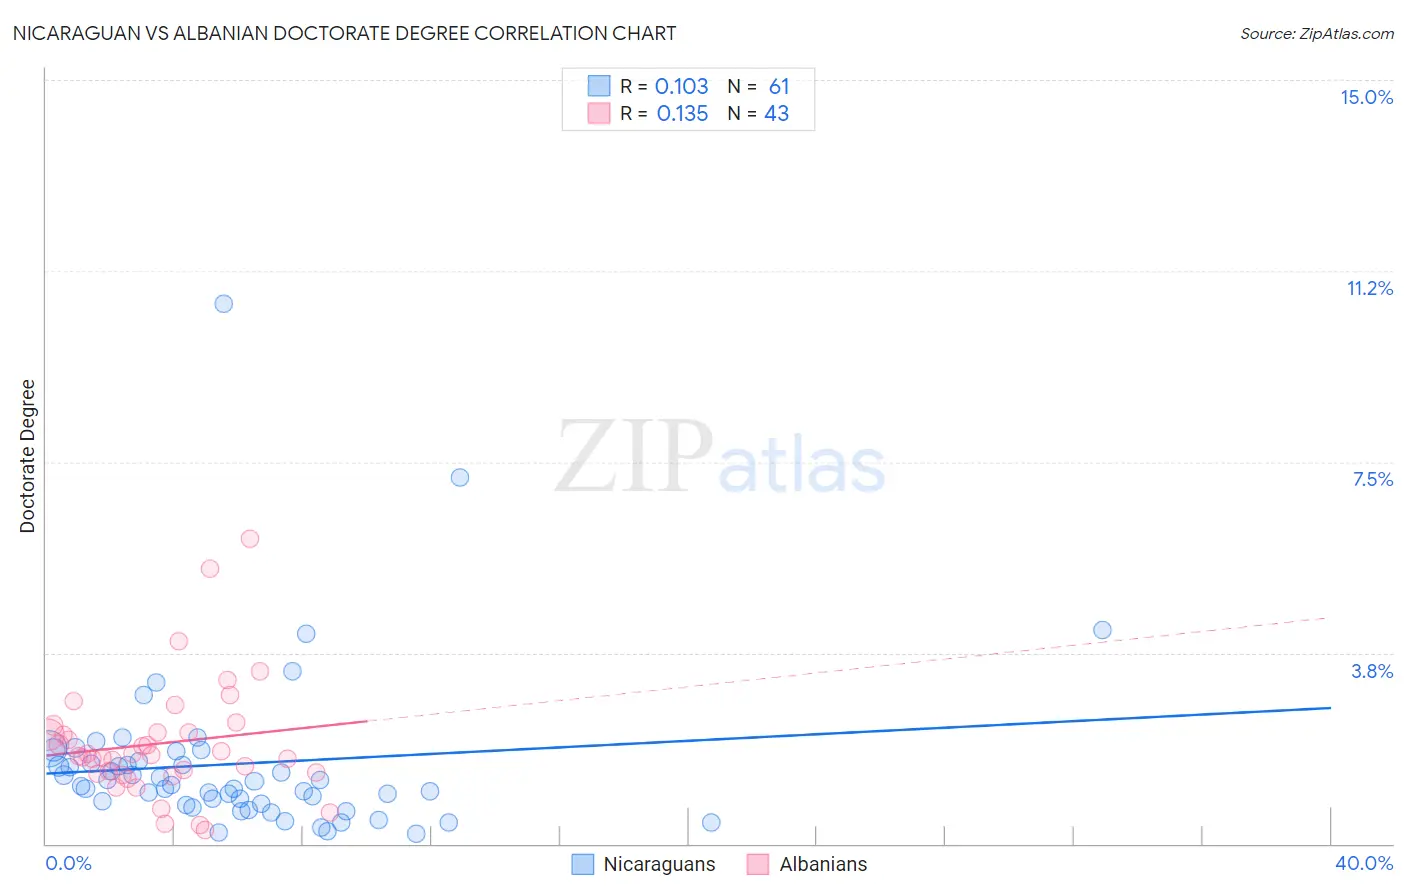
Nicaraguan vs Albanian Doctorate Degree Correlation Chart
The statistical analysis conducted on geographies consisting of 283,726,433 people shows a poor positive correlation between the proportion of Nicaraguans and percentage of population with at least doctorate degree education in the United States with a correlation coefficient (R) of 0.103 and weighted average of 1.5%. Similarly, the statistical analysis conducted on geographies consisting of 192,567,939 people shows a poor positive correlation between the proportion of Albanians and percentage of population with at least doctorate degree education in the United States with a correlation coefficient (R) of 0.135 and weighted average of 1.9%, a difference of 27.5%.
Doctorate Degree Correlation Summary
| Measurement | Nicaraguan | Albanian |
| Minimum | 0.20% | 0.26% |
| Maximum | 10.6% | 6.0% |
| Range | 10.4% | 5.7% |
| Mean | 1.6% | 2.0% |
| Median | 1.2% | 1.7% |
| Interquartile 25% (IQ1) | 0.78% | 1.4% |
| Interquartile 75% (IQ3) | 1.7% | 2.2% |
| Interquartile Range (IQR) | 0.94% | 0.81% |
| Standard Deviation (Sample) | 1.6% | 1.1% |
| Standard Deviation (Population) | 1.6% | 1.1% |
Similar Demographics by Doctorate Degree
Demographics Similar to Nicaraguans by Doctorate Degree
In terms of doctorate degree, the demographic groups most similar to Nicaraguans are Blackfeet (1.5%, a difference of 0.28%), Immigrants from Bahamas (1.5%, a difference of 0.47%), Chickasaw (1.5%, a difference of 0.64%), Immigrants from Liberia (1.5%, a difference of 0.78%), and Immigrants from Portugal (1.5%, a difference of 0.79%).
| Demographics | Rating | Rank | Doctorate Degree |
| Immigrants | West Indies | 0.9 /100 | #258 | Tragic 1.5% |
| Liberians | 0.9 /100 | #259 | Tragic 1.5% |
| Japanese | 0.9 /100 | #260 | Tragic 1.5% |
| Immigrants | Portugal | 0.8 /100 | #261 | Tragic 1.5% |
| Chickasaw | 0.7 /100 | #262 | Tragic 1.5% |
| Immigrants | Bahamas | 0.7 /100 | #263 | Tragic 1.5% |
| Blackfeet | 0.7 /100 | #264 | Tragic 1.5% |
| Nicaraguans | 0.6 /100 | #265 | Tragic 1.5% |
| Immigrants | Liberia | 0.5 /100 | #266 | Tragic 1.5% |
| Kiowa | 0.5 /100 | #267 | Tragic 1.5% |
| U.S. Virgin Islanders | 0.5 /100 | #268 | Tragic 1.5% |
| Crow | 0.5 /100 | #269 | Tragic 1.5% |
| Salvadorans | 0.5 /100 | #270 | Tragic 1.5% |
| Immigrants | Trinidad and Tobago | 0.5 /100 | #271 | Tragic 1.5% |
| Immigrants | Barbados | 0.4 /100 | #272 | Tragic 1.5% |
Demographics Similar to Albanians by Doctorate Degree
In terms of doctorate degree, the demographic groups most similar to Albanians are Immigrants from Kenya (1.9%, a difference of 0.10%), Immigrants from Oceania (1.9%, a difference of 0.15%), English (1.9%, a difference of 0.19%), Immigrants from Albania (1.9%, a difference of 0.37%), and Polish (1.9%, a difference of 0.39%).
| Demographics | Rating | Rank | Doctorate Degree |
| Immigrants | Moldova | 84.3 /100 | #144 | Excellent 2.0% |
| Kenyans | 83.6 /100 | #145 | Excellent 1.9% |
| Immigrants | Syria | 83.6 /100 | #146 | Excellent 1.9% |
| Immigrants | Senegal | 82.5 /100 | #147 | Excellent 1.9% |
| Luxembourgers | 81.1 /100 | #148 | Excellent 1.9% |
| Basques | 76.9 /100 | #149 | Good 1.9% |
| English | 75.9 /100 | #150 | Good 1.9% |
| Albanians | 74.8 /100 | #151 | Good 1.9% |
| Immigrants | Kenya | 74.3 /100 | #152 | Good 1.9% |
| Immigrants | Oceania | 74.0 /100 | #153 | Good 1.9% |
| Immigrants | Albania | 72.8 /100 | #154 | Good 1.9% |
| Poles | 72.7 /100 | #155 | Good 1.9% |
| Slavs | 72.4 /100 | #156 | Good 1.9% |
| Danes | 71.9 /100 | #157 | Good 1.9% |
| Hungarians | 71.7 /100 | #158 | Good 1.9% |