New Zealander vs Lumbee Single Female Poverty
COMPARE
New Zealander
Lumbee
Single Female Poverty
Single Female Poverty Comparison
New Zealanders
Lumbee
21.0%
SINGLE FEMALE POVERTY
53.2/ 100
METRIC RATING
170th/ 347
METRIC RANK
33.0%
SINGLE FEMALE POVERTY
0.0/ 100
METRIC RATING
344th/ 347
METRIC RANK
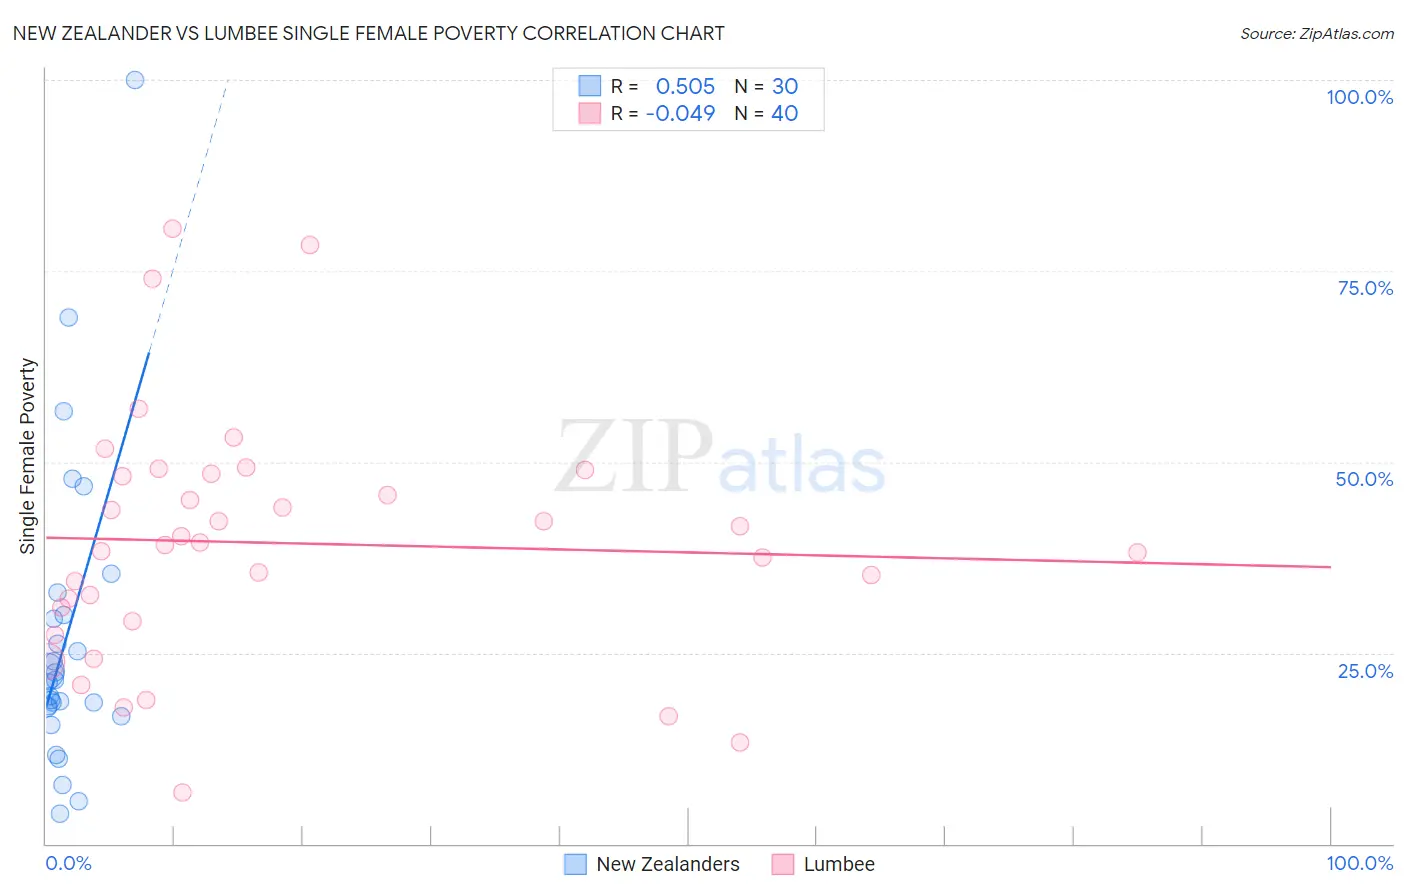
New Zealander vs Lumbee Single Female Poverty Correlation Chart
The statistical analysis conducted on geographies consisting of 106,229,490 people shows a substantial positive correlation between the proportion of New Zealanders and poverty level among single females in the United States with a correlation coefficient (R) of 0.505 and weighted average of 21.0%. Similarly, the statistical analysis conducted on geographies consisting of 91,816,335 people shows no correlation between the proportion of Lumbee and poverty level among single females in the United States with a correlation coefficient (R) of -0.049 and weighted average of 33.0%, a difference of 57.4%.
Single Female Poverty Correlation Summary
| Measurement | New Zealander | Lumbee |
| Minimum | 3.9% | 6.8% |
| Maximum | 100.0% | 80.6% |
| Range | 96.1% | 73.8% |
| Mean | 27.1% | 39.4% |
| Median | 21.3% | 39.3% |
| Interquartile 25% (IQ1) | 17.8% | 30.1% |
| Interquartile 75% (IQ3) | 29.9% | 48.3% |
| Interquartile Range (IQR) | 12.0% | 18.2% |
| Standard Deviation (Sample) | 20.0% | 16.1% |
| Standard Deviation (Population) | 19.7% | 15.9% |
Similar Demographics by Single Female Poverty
Demographics Similar to New Zealanders by Single Female Poverty
In terms of single female poverty, the demographic groups most similar to New Zealanders are Moroccan (21.0%, a difference of 0.020%), Guyanese (21.0%, a difference of 0.070%), Immigrants from Guyana (21.0%, a difference of 0.16%), Immigrants from Trinidad and Tobago (20.9%, a difference of 0.20%), and Cuban (21.0%, a difference of 0.20%).
| Demographics | Rating | Rank | Single Female Poverty |
| Lebanese | 67.6 /100 | #163 | Good 20.8% |
| Iraqis | 64.5 /100 | #164 | Good 20.8% |
| Ugandans | 64.0 /100 | #165 | Good 20.8% |
| Norwegians | 63.0 /100 | #166 | Good 20.8% |
| Immigrants | Norway | 63.0 /100 | #167 | Good 20.8% |
| Immigrants | Costa Rica | 61.5 /100 | #168 | Good 20.9% |
| Immigrants | Trinidad and Tobago | 56.3 /100 | #169 | Average 20.9% |
| New Zealanders | 53.2 /100 | #170 | Average 21.0% |
| Moroccans | 52.8 /100 | #171 | Average 21.0% |
| Guyanese | 52.0 /100 | #172 | Average 21.0% |
| Immigrants | Guyana | 50.6 /100 | #173 | Average 21.0% |
| Cubans | 50.0 /100 | #174 | Average 21.0% |
| Czechs | 46.8 /100 | #175 | Average 21.0% |
| Canadians | 45.4 /100 | #176 | Average 21.1% |
| Scandinavians | 45.2 /100 | #177 | Average 21.1% |
Demographics Similar to Lumbee by Single Female Poverty
In terms of single female poverty, the demographic groups most similar to Lumbee are Crow (32.4%, a difference of 1.8%), Houma (33.8%, a difference of 2.4%), Puerto Rican (34.1%, a difference of 3.3%), Tohono O'odham (34.2%, a difference of 3.6%), and Navajo (31.7%, a difference of 4.3%).
| Demographics | Rating | Rank | Single Female Poverty |
| Ute | 0.0 /100 | #333 | Tragic 28.4% |
| Pueblo | 0.0 /100 | #334 | Tragic 28.6% |
| Immigrants | Yemen | 0.0 /100 | #335 | Tragic 28.9% |
| Colville | 0.0 /100 | #336 | Tragic 29.1% |
| Yuman | 0.0 /100 | #337 | Tragic 29.4% |
| Pima | 0.0 /100 | #338 | Tragic 30.3% |
| Cheyenne | 0.0 /100 | #339 | Tragic 30.4% |
| Cajuns | 0.0 /100 | #340 | Tragic 30.6% |
| Sioux | 0.0 /100 | #341 | Tragic 31.3% |
| Navajo | 0.0 /100 | #342 | Tragic 31.7% |
| Crow | 0.0 /100 | #343 | Tragic 32.4% |
| Lumbee | 0.0 /100 | #344 | Tragic 33.0% |
| Houma | 0.0 /100 | #345 | Tragic 33.8% |
| Puerto Ricans | 0.0 /100 | #346 | Tragic 34.1% |
| Tohono O'odham | 0.0 /100 | #347 | Tragic 34.2% |