New Zealander vs Alaskan Athabascan Child Poverty Among Boys Under 16
COMPARE
New Zealander
Alaskan Athabascan
Child Poverty Among Boys Under 16
Child Poverty Among Boys Under 16 Comparison
New Zealanders
Alaskan Athabascans
15.7%
CHILD POVERTY AMONG BOYS UNDER 16
82.4/ 100
METRIC RATING
146th/ 347
METRIC RANK
17.6%
CHILD POVERTY AMONG BOYS UNDER 16
7.3/ 100
METRIC RATING
209th/ 347
METRIC RANK
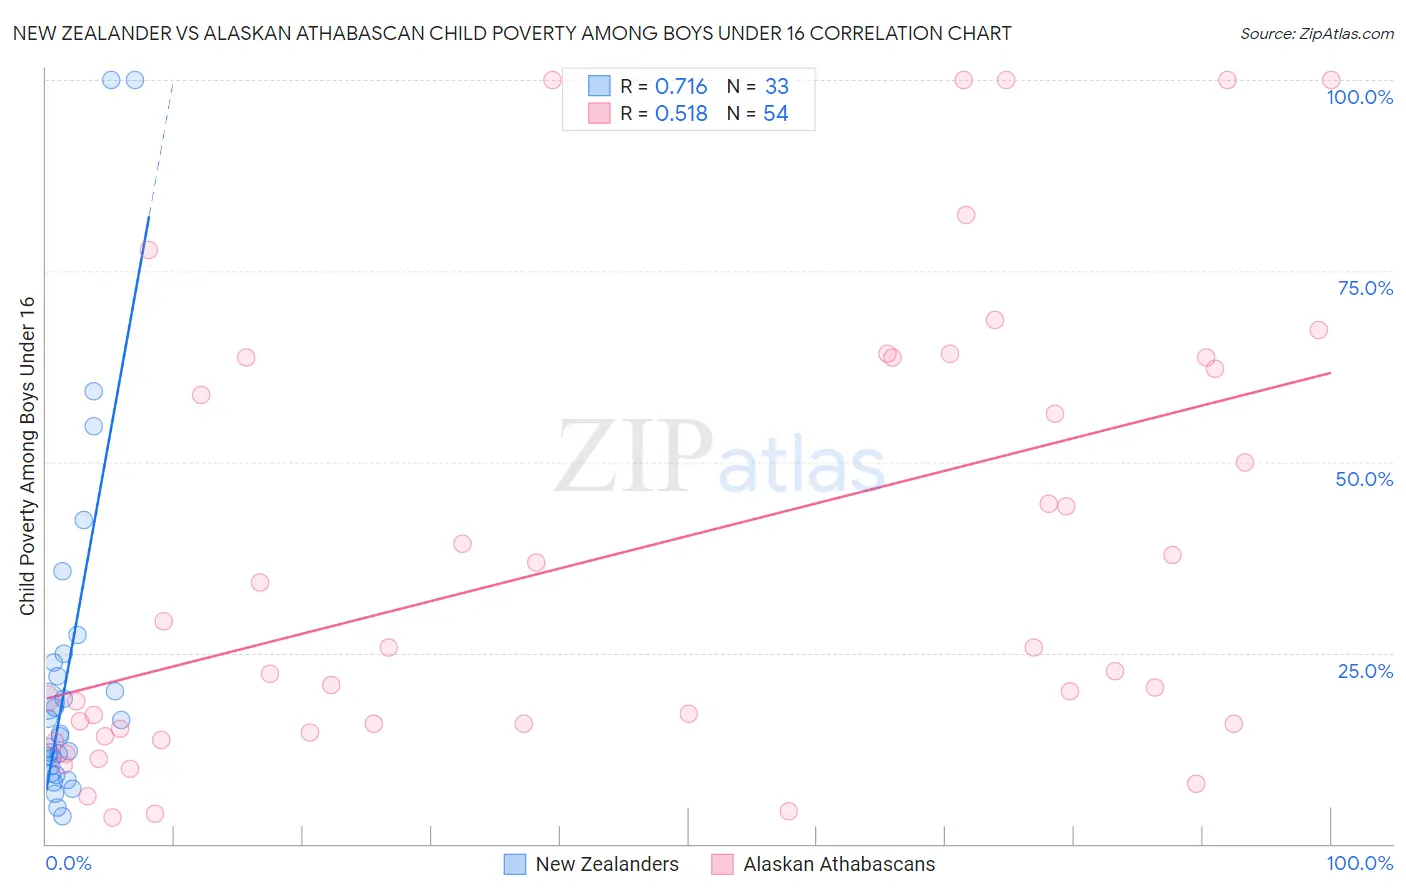
New Zealander vs Alaskan Athabascan Child Poverty Among Boys Under 16 Correlation Chart
The statistical analysis conducted on geographies consisting of 106,111,867 people shows a strong positive correlation between the proportion of New Zealanders and poverty level among boys under the age of 16 in the United States with a correlation coefficient (R) of 0.716 and weighted average of 15.7%. Similarly, the statistical analysis conducted on geographies consisting of 45,576,006 people shows a substantial positive correlation between the proportion of Alaskan Athabascans and poverty level among boys under the age of 16 in the United States with a correlation coefficient (R) of 0.518 and weighted average of 17.6%, a difference of 11.9%.
Child Poverty Among Boys Under 16 Correlation Summary
| Measurement | New Zealander | Alaskan Athabascan |
| Minimum | 3.6% | 3.4% |
| Maximum | 100.0% | 100.0% |
| Range | 96.4% | 96.6% |
| Mean | 23.2% | 37.8% |
| Median | 14.4% | 24.1% |
| Interquartile 25% (IQ1) | 9.7% | 15.0% |
| Interquartile 75% (IQ3) | 24.3% | 63.6% |
| Interquartile Range (IQR) | 14.6% | 48.6% |
| Standard Deviation (Sample) | 23.7% | 29.5% |
| Standard Deviation (Population) | 23.4% | 29.2% |
Similar Demographics by Child Poverty Among Boys Under 16
Demographics Similar to New Zealanders by Child Poverty Among Boys Under 16
In terms of child poverty among boys under 16, the demographic groups most similar to New Zealanders are Venezuelan (15.7%, a difference of 0.070%), Samoan (15.7%, a difference of 0.16%), Immigrants from Peru (15.7%, a difference of 0.21%), Immigrants from Fiji (15.7%, a difference of 0.24%), and Brazilian (15.8%, a difference of 0.27%).
| Demographics | Rating | Rank | Child Poverty Among Boys Under 16 |
| Albanians | 86.5 /100 | #139 | Excellent 15.6% |
| Immigrants | Kuwait | 85.6 /100 | #140 | Excellent 15.6% |
| Slavs | 84.5 /100 | #141 | Excellent 15.7% |
| Immigrants | Hungary | 84.1 /100 | #142 | Excellent 15.7% |
| Immigrants | Fiji | 83.6 /100 | #143 | Excellent 15.7% |
| Immigrants | Peru | 83.5 /100 | #144 | Excellent 15.7% |
| Samoans | 83.2 /100 | #145 | Excellent 15.7% |
| New Zealanders | 82.4 /100 | #146 | Excellent 15.7% |
| Venezuelans | 82.1 /100 | #147 | Excellent 15.7% |
| Brazilians | 81.0 /100 | #148 | Excellent 15.8% |
| Slovaks | 80.3 /100 | #149 | Excellent 15.8% |
| Immigrants | Jordan | 80.2 /100 | #150 | Excellent 15.8% |
| Puget Sound Salish | 79.8 /100 | #151 | Good 15.8% |
| Immigrants | Venezuela | 79.5 /100 | #152 | Good 15.8% |
| French | 78.7 /100 | #153 | Good 15.8% |
Demographics Similar to Alaskan Athabascans by Child Poverty Among Boys Under 16
In terms of child poverty among boys under 16, the demographic groups most similar to Alaskan Athabascans are Malaysian (17.6%, a difference of 0.11%), Immigrants from Armenia (17.6%, a difference of 0.18%), Immigrants (17.6%, a difference of 0.24%), Aleut (17.7%, a difference of 0.29%), and Immigrants from Thailand (17.5%, a difference of 0.32%).
| Demographics | Rating | Rank | Child Poverty Among Boys Under 16 |
| Immigrants | Sierra Leone | 13.4 /100 | #202 | Poor 17.3% |
| Immigrants | Uzbekistan | 13.3 /100 | #203 | Poor 17.3% |
| Ugandans | 12.5 /100 | #204 | Poor 17.3% |
| Immigrants | Portugal | 11.2 /100 | #205 | Poor 17.4% |
| German Russians | 10.9 /100 | #206 | Poor 17.4% |
| Immigrants | Thailand | 8.2 /100 | #207 | Tragic 17.5% |
| Malaysians | 7.6 /100 | #208 | Tragic 17.6% |
| Alaskan Athabascans | 7.3 /100 | #209 | Tragic 17.6% |
| Immigrants | Armenia | 6.8 /100 | #210 | Tragic 17.6% |
| Immigrants | Immigrants | 6.7 /100 | #211 | Tragic 17.6% |
| Aleuts | 6.6 /100 | #212 | Tragic 17.7% |
| Immigrants | Eastern Africa | 6.0 /100 | #213 | Tragic 17.7% |
| Panamanians | 5.9 /100 | #214 | Tragic 17.7% |
| Osage | 5.8 /100 | #215 | Tragic 17.7% |
| Moroccans | 5.6 /100 | #216 | Tragic 17.7% |