Native/Alaskan vs Mexican Receiving Food Stamps
COMPARE
Native/Alaskan
Mexican
Receiving Food Stamps
Receiving Food Stamps Comparison
Natives/Alaskans
Mexicans
17.3%
RECEIVING FOOD STAMPS
0.0/ 100
METRIC RATING
321st/ 347
METRIC RANK
14.6%
RECEIVING FOOD STAMPS
0.1/ 100
METRIC RATING
270th/ 347
METRIC RANK
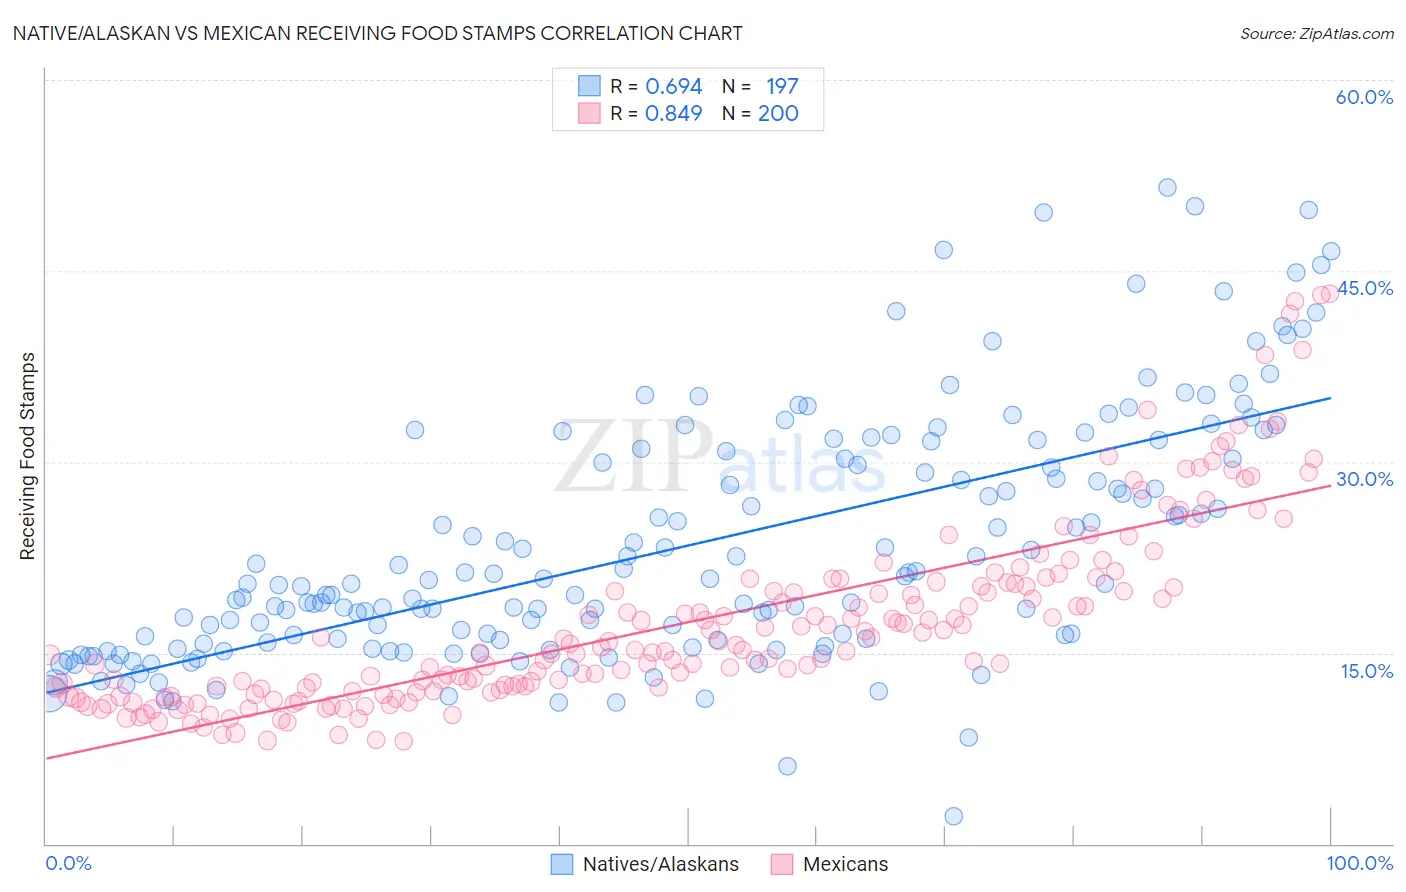
Native/Alaskan vs Mexican Receiving Food Stamps Correlation Chart
The statistical analysis conducted on geographies consisting of 511,480,561 people shows a significant positive correlation between the proportion of Natives/Alaskans and percentage of population receiving government assistance and/or food stamps in the United States with a correlation coefficient (R) of 0.694 and weighted average of 17.3%. Similarly, the statistical analysis conducted on geographies consisting of 562,221,656 people shows a very strong positive correlation between the proportion of Mexicans and percentage of population receiving government assistance and/or food stamps in the United States with a correlation coefficient (R) of 0.849 and weighted average of 14.6%, a difference of 18.0%.
Receiving Food Stamps Correlation Summary
| Measurement | Native/Alaskan | Mexican |
| Minimum | 2.2% | 8.0% |
| Maximum | 51.6% | 43.2% |
| Range | 49.4% | 35.2% |
| Mean | 23.4% | 17.4% |
| Median | 20.4% | 15.2% |
| Interquartile 25% (IQ1) | 15.8% | 12.1% |
| Interquartile 75% (IQ3) | 30.5% | 20.3% |
| Interquartile Range (IQR) | 14.7% | 8.2% |
| Standard Deviation (Sample) | 9.7% | 7.3% |
| Standard Deviation (Population) | 9.7% | 7.3% |
Similar Demographics by Receiving Food Stamps
Demographics Similar to Natives/Alaskans by Receiving Food Stamps
In terms of receiving food stamps, the demographic groups most similar to Natives/Alaskans are Immigrants from Nicaragua (17.2%, a difference of 0.18%), Immigrants from St. Vincent and the Grenadines (17.2%, a difference of 0.26%), Menominee (17.2%, a difference of 0.44%), Black/African American (17.2%, a difference of 0.62%), and Central American Indian (17.1%, a difference of 1.1%).
| Demographics | Rating | Rank | Receiving Food Stamps |
| Immigrants | Guyana | 0.0 /100 | #314 | Tragic 16.9% |
| Bahamians | 0.0 /100 | #315 | Tragic 17.0% |
| Central American Indians | 0.0 /100 | #316 | Tragic 17.1% |
| Blacks/African Americans | 0.0 /100 | #317 | Tragic 17.2% |
| Menominee | 0.0 /100 | #318 | Tragic 17.2% |
| Immigrants | St. Vincent and the Grenadines | 0.0 /100 | #319 | Tragic 17.2% |
| Immigrants | Nicaragua | 0.0 /100 | #320 | Tragic 17.2% |
| Natives/Alaskans | 0.0 /100 | #321 | Tragic 17.3% |
| Immigrants | Grenada | 0.0 /100 | #322 | Tragic 17.8% |
| Haitians | 0.0 /100 | #323 | Tragic 17.8% |
| British West Indians | 0.0 /100 | #324 | Tragic 17.9% |
| Immigrants | Haiti | 0.0 /100 | #325 | Tragic 18.2% |
| Cubans | 0.0 /100 | #326 | Tragic 18.2% |
| Apache | 0.0 /100 | #327 | Tragic 18.3% |
| Colville | 0.0 /100 | #328 | Tragic 18.3% |
Demographics Similar to Mexicans by Receiving Food Stamps
In terms of receiving food stamps, the demographic groups most similar to Mexicans are Immigrants from Guatemala (14.6%, a difference of 0.090%), Nepalese (14.6%, a difference of 0.20%), Chippewa (14.7%, a difference of 0.32%), Alaskan Athabascan (14.7%, a difference of 0.35%), and Immigrants from Western Africa (14.7%, a difference of 0.36%).
| Demographics | Rating | Rank | Receiving Food Stamps |
| Immigrants | Portugal | 0.2 /100 | #263 | Tragic 14.3% |
| Immigrants | Uzbekistan | 0.2 /100 | #264 | Tragic 14.3% |
| Blackfeet | 0.2 /100 | #265 | Tragic 14.3% |
| Cheyenne | 0.2 /100 | #266 | Tragic 14.3% |
| Dutch West Indians | 0.2 /100 | #267 | Tragic 14.3% |
| Guatemalans | 0.1 /100 | #268 | Tragic 14.4% |
| Nepalese | 0.1 /100 | #269 | Tragic 14.6% |
| Mexicans | 0.1 /100 | #270 | Tragic 14.6% |
| Immigrants | Guatemala | 0.1 /100 | #271 | Tragic 14.6% |
| Chippewa | 0.1 /100 | #272 | Tragic 14.7% |
| Alaskan Athabascans | 0.1 /100 | #273 | Tragic 14.7% |
| Immigrants | Western Africa | 0.1 /100 | #274 | Tragic 14.7% |
| Ute | 0.1 /100 | #275 | Tragic 14.7% |
| Liberians | 0.1 /100 | #276 | Tragic 14.8% |
| Seminole | 0.1 /100 | #277 | Tragic 14.8% |