Native/Alaskan vs Immigrants from South Central Asia Receiving Food Stamps
COMPARE
Native/Alaskan
Immigrants from South Central Asia
Receiving Food Stamps
Receiving Food Stamps Comparison
Natives/Alaskans
Immigrants from South Central Asia
17.3%
RECEIVING FOOD STAMPS
0.0/ 100
METRIC RATING
321st/ 347
METRIC RANK
8.8%
RECEIVING FOOD STAMPS
99.9/ 100
METRIC RATING
10th/ 347
METRIC RANK
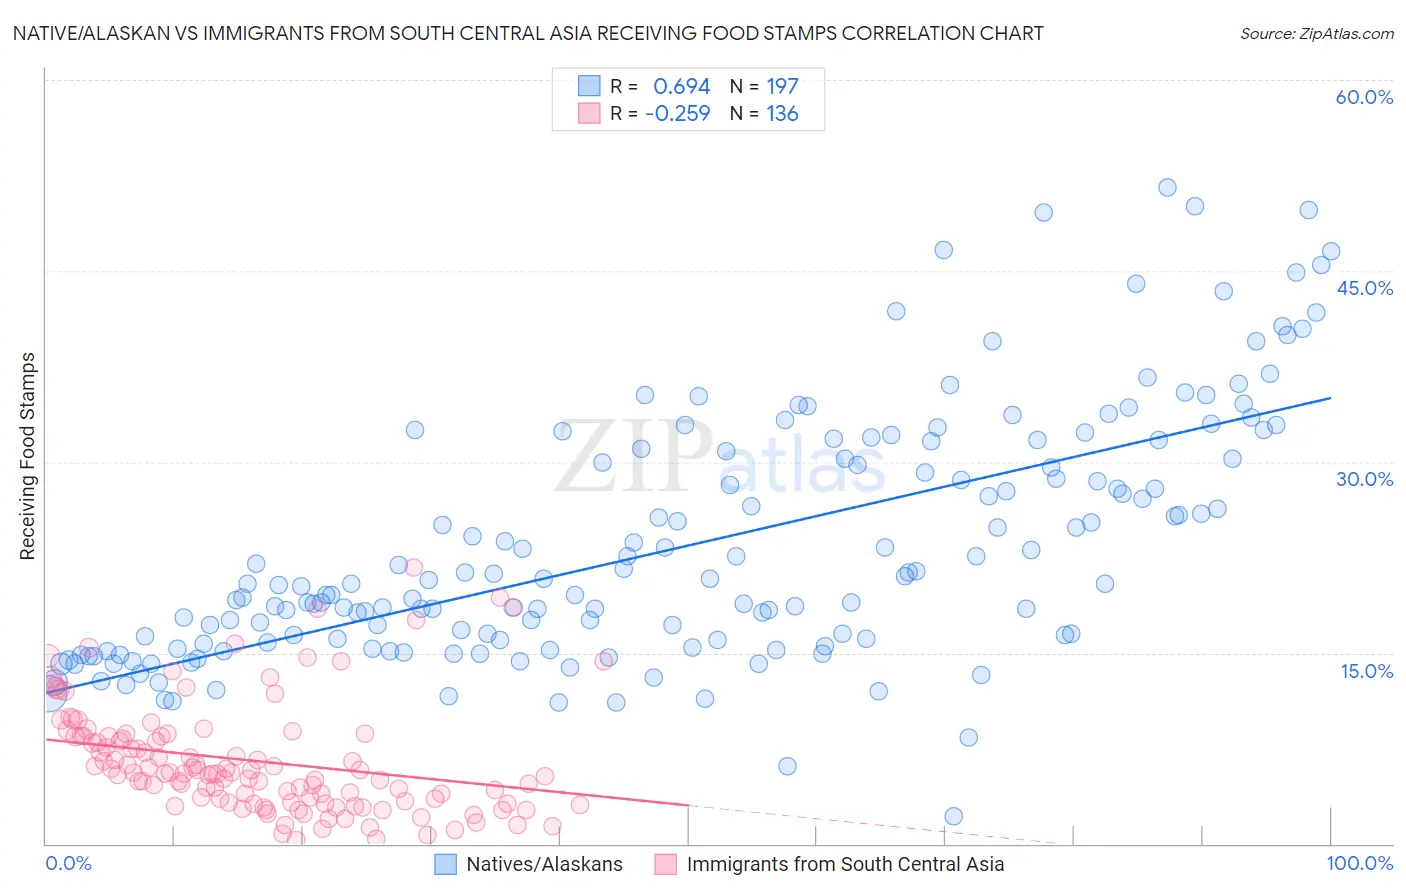
Native/Alaskan vs Immigrants from South Central Asia Receiving Food Stamps Correlation Chart
The statistical analysis conducted on geographies consisting of 511,480,561 people shows a significant positive correlation between the proportion of Natives/Alaskans and percentage of population receiving government assistance and/or food stamps in the United States with a correlation coefficient (R) of 0.694 and weighted average of 17.3%. Similarly, the statistical analysis conducted on geographies consisting of 471,034,048 people shows a weak negative correlation between the proportion of Immigrants from South Central Asia and percentage of population receiving government assistance and/or food stamps in the United States with a correlation coefficient (R) of -0.259 and weighted average of 8.8%, a difference of 95.6%.
Receiving Food Stamps Correlation Summary
| Measurement | Native/Alaskan | Immigrants from South Central Asia |
| Minimum | 2.2% | 0.30% |
| Maximum | 51.6% | 21.7% |
| Range | 49.4% | 21.4% |
| Mean | 23.4% | 6.5% |
| Median | 20.4% | 5.6% |
| Interquartile 25% (IQ1) | 15.8% | 3.3% |
| Interquartile 75% (IQ3) | 30.5% | 8.5% |
| Interquartile Range (IQR) | 14.7% | 5.2% |
| Standard Deviation (Sample) | 9.7% | 4.3% |
| Standard Deviation (Population) | 9.7% | 4.3% |
Similar Demographics by Receiving Food Stamps
Demographics Similar to Natives/Alaskans by Receiving Food Stamps
In terms of receiving food stamps, the demographic groups most similar to Natives/Alaskans are Immigrants from Nicaragua (17.2%, a difference of 0.18%), Immigrants from St. Vincent and the Grenadines (17.2%, a difference of 0.26%), Menominee (17.2%, a difference of 0.44%), Black/African American (17.2%, a difference of 0.62%), and Central American Indian (17.1%, a difference of 1.1%).
| Demographics | Rating | Rank | Receiving Food Stamps |
| Immigrants | Guyana | 0.0 /100 | #314 | Tragic 16.9% |
| Bahamians | 0.0 /100 | #315 | Tragic 17.0% |
| Central American Indians | 0.0 /100 | #316 | Tragic 17.1% |
| Blacks/African Americans | 0.0 /100 | #317 | Tragic 17.2% |
| Menominee | 0.0 /100 | #318 | Tragic 17.2% |
| Immigrants | St. Vincent and the Grenadines | 0.0 /100 | #319 | Tragic 17.2% |
| Immigrants | Nicaragua | 0.0 /100 | #320 | Tragic 17.2% |
| Natives/Alaskans | 0.0 /100 | #321 | Tragic 17.3% |
| Immigrants | Grenada | 0.0 /100 | #322 | Tragic 17.8% |
| Haitians | 0.0 /100 | #323 | Tragic 17.8% |
| British West Indians | 0.0 /100 | #324 | Tragic 17.9% |
| Immigrants | Haiti | 0.0 /100 | #325 | Tragic 18.2% |
| Cubans | 0.0 /100 | #326 | Tragic 18.2% |
| Apache | 0.0 /100 | #327 | Tragic 18.3% |
| Colville | 0.0 /100 | #328 | Tragic 18.3% |
Demographics Similar to Immigrants from South Central Asia by Receiving Food Stamps
In terms of receiving food stamps, the demographic groups most similar to Immigrants from South Central Asia are Okinawan (8.9%, a difference of 0.43%), Cypriot (8.9%, a difference of 0.44%), Bulgarian (8.9%, a difference of 0.63%), Maltese (8.9%, a difference of 0.77%), and Norwegian (9.0%, a difference of 1.4%).
| Demographics | Rating | Rank | Receiving Food Stamps |
| Filipinos | 100.0 /100 | #3 | Exceptional 7.4% |
| Iranians | 100.0 /100 | #4 | Exceptional 7.9% |
| Thais | 100.0 /100 | #5 | Exceptional 8.1% |
| Immigrants | Singapore | 100.0 /100 | #6 | Exceptional 8.3% |
| Immigrants | Iran | 100.0 /100 | #7 | Exceptional 8.3% |
| Burmese | 99.9 /100 | #8 | Exceptional 8.6% |
| Immigrants | Korea | 99.9 /100 | #9 | Exceptional 8.7% |
| Immigrants | South Central Asia | 99.9 /100 | #10 | Exceptional 8.8% |
| Okinawans | 99.9 /100 | #11 | Exceptional 8.9% |
| Cypriots | 99.9 /100 | #12 | Exceptional 8.9% |
| Bulgarians | 99.9 /100 | #13 | Exceptional 8.9% |
| Maltese | 99.9 /100 | #14 | Exceptional 8.9% |
| Norwegians | 99.9 /100 | #15 | Exceptional 9.0% |
| Immigrants | Japan | 99.9 /100 | #16 | Exceptional 9.0% |
| Immigrants | Scotland | 99.9 /100 | #17 | Exceptional 9.0% |