Native/Alaskan vs Italian Child Poverty Among Girls Under 16
COMPARE
Native/Alaskan
Italian
Child Poverty Among Girls Under 16
Child Poverty Among Girls Under 16 Comparison
Natives/Alaskans
Italians
24.0%
CHILD POVERTY AMONG GIRLS UNDER 16
0.0/ 100
METRIC RATING
332nd/ 347
METRIC RANK
14.3%
CHILD POVERTY AMONG GIRLS UNDER 16
99.1/ 100
METRIC RATING
52nd/ 347
METRIC RANK
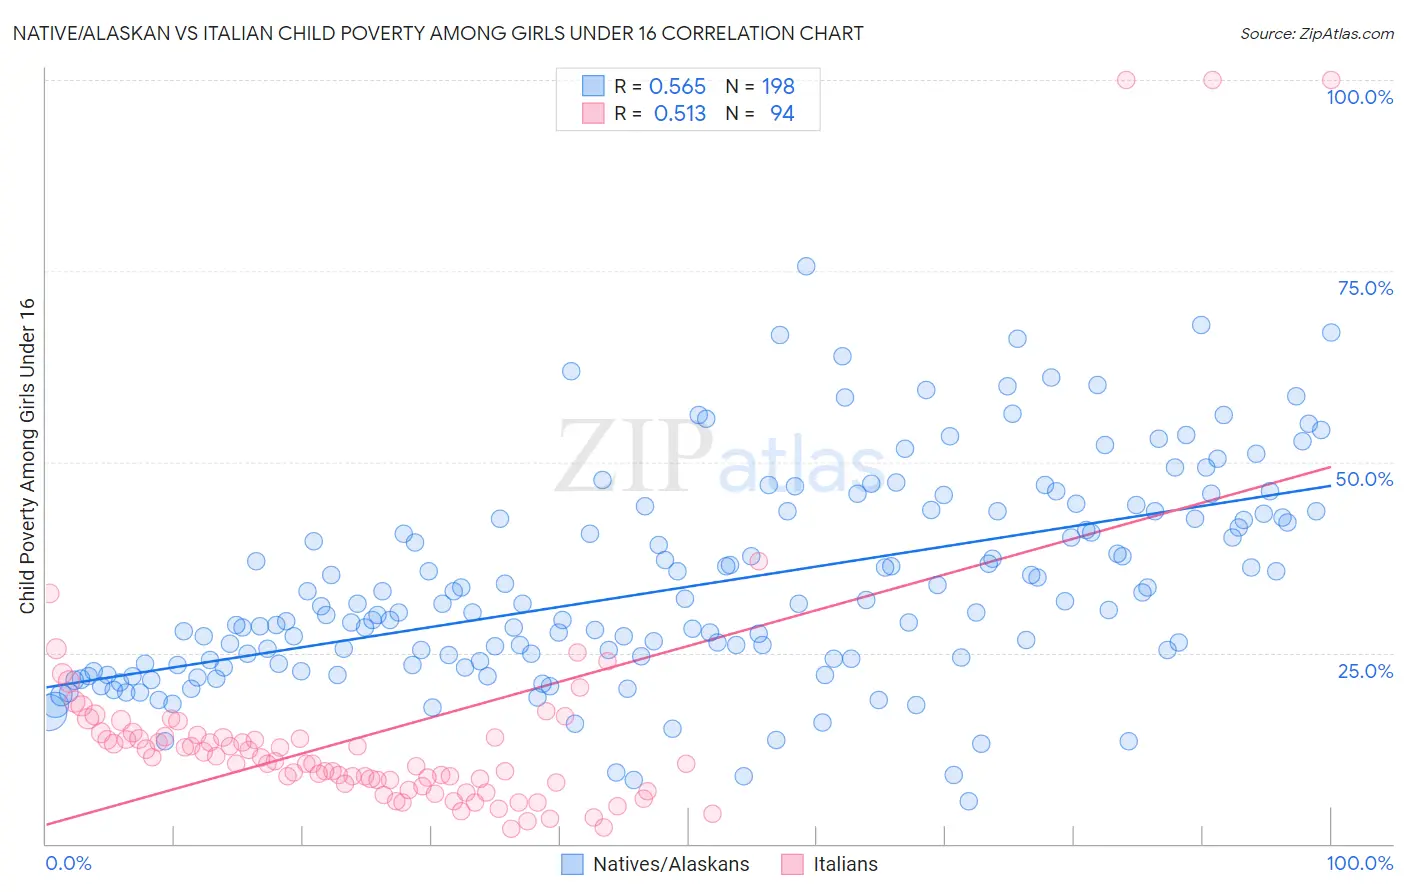
Native/Alaskan vs Italian Child Poverty Among Girls Under 16 Correlation Chart
The statistical analysis conducted on geographies consisting of 501,562,202 people shows a substantial positive correlation between the proportion of Natives/Alaskans and poverty level among girls under the age of 16 in the United States with a correlation coefficient (R) of 0.565 and weighted average of 24.0%. Similarly, the statistical analysis conducted on geographies consisting of 551,674,054 people shows a substantial positive correlation between the proportion of Italians and poverty level among girls under the age of 16 in the United States with a correlation coefficient (R) of 0.513 and weighted average of 14.3%, a difference of 68.5%.
Child Poverty Among Girls Under 16 Correlation Summary
| Measurement | Native/Alaskan | Italian |
| Minimum | 5.5% | 2.0% |
| Maximum | 75.5% | 100.0% |
| Range | 70.0% | 98.0% |
| Mean | 33.7% | 14.4% |
| Median | 30.5% | 10.7% |
| Interquartile 25% (IQ1) | 23.6% | 7.9% |
| Interquartile 75% (IQ3) | 42.8% | 14.0% |
| Interquartile Range (IQR) | 19.2% | 6.1% |
| Standard Deviation (Sample) | 13.6% | 16.8% |
| Standard Deviation (Population) | 13.5% | 16.7% |
Similar Demographics by Child Poverty Among Girls Under 16
Demographics Similar to Natives/Alaskans by Child Poverty Among Girls Under 16
In terms of child poverty among girls under 16, the demographic groups most similar to Natives/Alaskans are Apache (23.8%, a difference of 0.86%), Immigrants from Dominican Republic (23.8%, a difference of 0.91%), Kiowa (23.7%, a difference of 1.5%), Dominican (23.7%, a difference of 1.6%), and Black/African American (24.7%, a difference of 2.5%).
| Demographics | Rating | Rank | Child Poverty Among Girls Under 16 |
| Immigrants | Congo | 0.0 /100 | #325 | Tragic 22.7% |
| Immigrants | Honduras | 0.0 /100 | #326 | Tragic 22.8% |
| Central American Indians | 0.0 /100 | #327 | Tragic 22.8% |
| Dominicans | 0.0 /100 | #328 | Tragic 23.7% |
| Kiowa | 0.0 /100 | #329 | Tragic 23.7% |
| Immigrants | Dominican Republic | 0.0 /100 | #330 | Tragic 23.8% |
| Apache | 0.0 /100 | #331 | Tragic 23.8% |
| Natives/Alaskans | 0.0 /100 | #332 | Tragic 24.0% |
| Blacks/African Americans | 0.0 /100 | #333 | Tragic 24.7% |
| Menominee | 0.0 /100 | #334 | Tragic 25.0% |
| Pueblo | 0.0 /100 | #335 | Tragic 25.2% |
| Sioux | 0.0 /100 | #336 | Tragic 25.6% |
| Yup'ik | 0.0 /100 | #337 | Tragic 25.8% |
| Cheyenne | 0.0 /100 | #338 | Tragic 26.3% |
| Crow | 0.0 /100 | #339 | Tragic 26.4% |
Demographics Similar to Italians by Child Poverty Among Girls Under 16
In terms of child poverty among girls under 16, the demographic groups most similar to Italians are Luxembourger (14.3%, a difference of 0.070%), Immigrants from Pakistan (14.2%, a difference of 0.14%), Estonian (14.3%, a difference of 0.50%), Immigrants from Romania (14.3%, a difference of 0.54%), and Immigrants from Indonesia (14.4%, a difference of 0.61%).
| Demographics | Rating | Rank | Child Poverty Among Girls Under 16 |
| Immigrants | Greece | 99.3 /100 | #45 | Exceptional 14.1% |
| Croatians | 99.3 /100 | #46 | Exceptional 14.1% |
| Immigrants | Czechoslovakia | 99.3 /100 | #47 | Exceptional 14.2% |
| Czechs | 99.3 /100 | #48 | Exceptional 14.2% |
| Greeks | 99.2 /100 | #49 | Exceptional 14.2% |
| Immigrants | Israel | 99.2 /100 | #50 | Exceptional 14.2% |
| Immigrants | Pakistan | 99.1 /100 | #51 | Exceptional 14.2% |
| Italians | 99.1 /100 | #52 | Exceptional 14.3% |
| Luxembourgers | 99.0 /100 | #53 | Exceptional 14.3% |
| Estonians | 98.9 /100 | #54 | Exceptional 14.3% |
| Immigrants | Romania | 98.9 /100 | #55 | Exceptional 14.3% |
| Immigrants | Indonesia | 98.9 /100 | #56 | Exceptional 14.4% |
| Immigrants | Serbia | 98.9 /100 | #57 | Exceptional 14.4% |
| Immigrants | Bulgaria | 98.8 /100 | #58 | Exceptional 14.4% |
| Zimbabweans | 98.8 /100 | #59 | Exceptional 14.4% |