Native/Alaskan vs Immigrants from Bulgaria Child Poverty Among Girls Under 16
COMPARE
Native/Alaskan
Immigrants from Bulgaria
Child Poverty Among Girls Under 16
Child Poverty Among Girls Under 16 Comparison
Natives/Alaskans
Immigrants from Bulgaria
24.0%
CHILD POVERTY AMONG GIRLS UNDER 16
0.0/ 100
METRIC RATING
332nd/ 347
METRIC RANK
14.4%
CHILD POVERTY AMONG GIRLS UNDER 16
98.8/ 100
METRIC RATING
58th/ 347
METRIC RANK
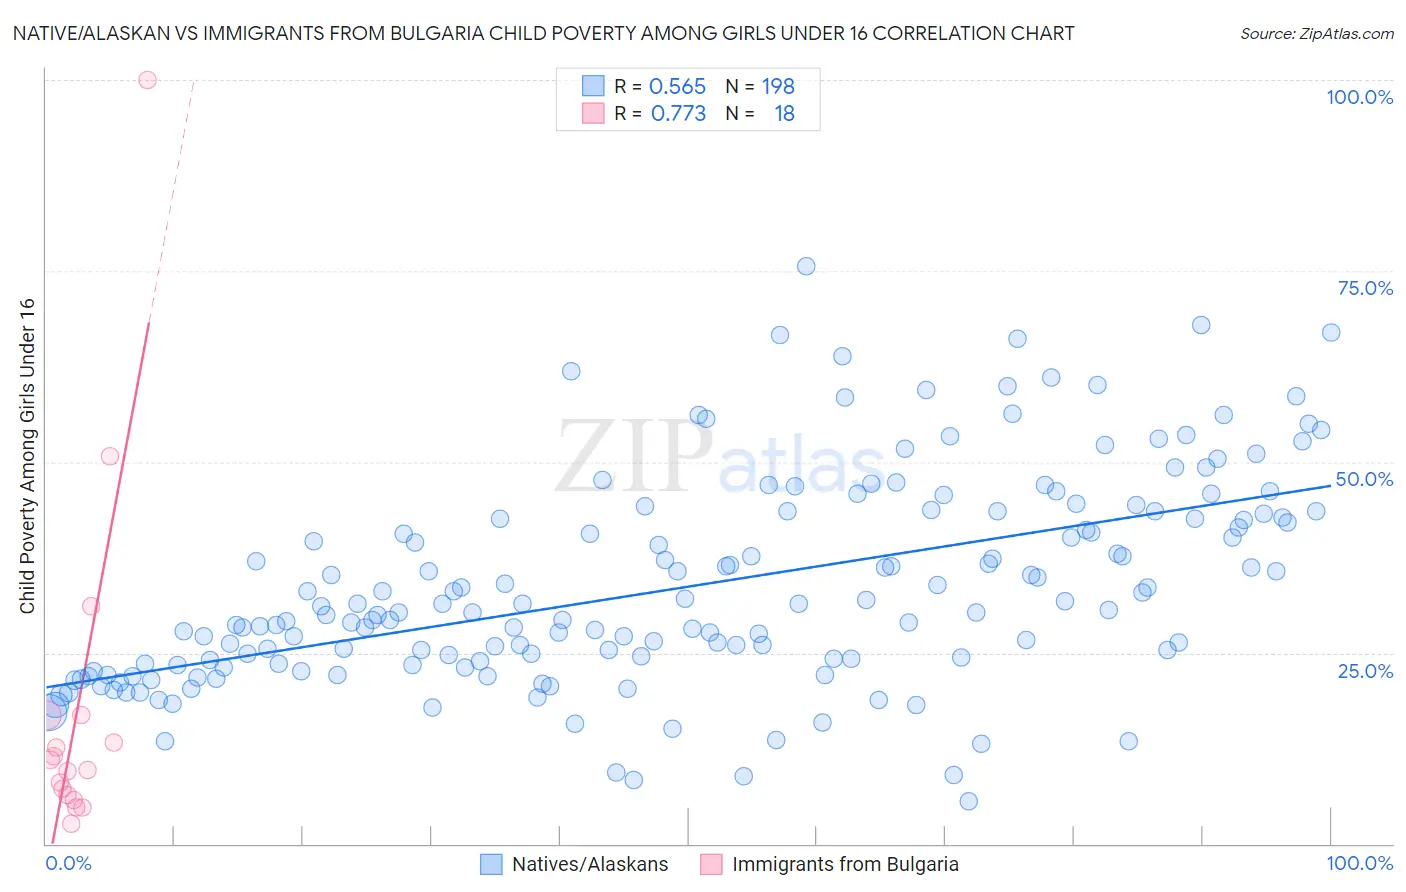
Native/Alaskan vs Immigrants from Bulgaria Child Poverty Among Girls Under 16 Correlation Chart
The statistical analysis conducted on geographies consisting of 501,562,202 people shows a substantial positive correlation between the proportion of Natives/Alaskans and poverty level among girls under the age of 16 in the United States with a correlation coefficient (R) of 0.565 and weighted average of 24.0%. Similarly, the statistical analysis conducted on geographies consisting of 170,743,744 people shows a strong positive correlation between the proportion of Immigrants from Bulgaria and poverty level among girls under the age of 16 in the United States with a correlation coefficient (R) of 0.773 and weighted average of 14.4%, a difference of 67.3%.
Child Poverty Among Girls Under 16 Correlation Summary
| Measurement | Native/Alaskan | Immigrants from Bulgaria |
| Minimum | 5.5% | 2.6% |
| Maximum | 75.5% | 100.0% |
| Range | 70.0% | 97.4% |
| Mean | 33.7% | 17.9% |
| Median | 30.5% | 10.4% |
| Interquartile 25% (IQ1) | 23.6% | 6.3% |
| Interquartile 75% (IQ3) | 42.8% | 16.8% |
| Interquartile Range (IQR) | 19.2% | 10.5% |
| Standard Deviation (Sample) | 13.6% | 23.4% |
| Standard Deviation (Population) | 13.5% | 22.8% |
Similar Demographics by Child Poverty Among Girls Under 16
Demographics Similar to Natives/Alaskans by Child Poverty Among Girls Under 16
In terms of child poverty among girls under 16, the demographic groups most similar to Natives/Alaskans are Apache (23.8%, a difference of 0.86%), Immigrants from Dominican Republic (23.8%, a difference of 0.91%), Kiowa (23.7%, a difference of 1.5%), Dominican (23.7%, a difference of 1.6%), and Black/African American (24.7%, a difference of 2.5%).
| Demographics | Rating | Rank | Child Poverty Among Girls Under 16 |
| Immigrants | Congo | 0.0 /100 | #325 | Tragic 22.7% |
| Immigrants | Honduras | 0.0 /100 | #326 | Tragic 22.8% |
| Central American Indians | 0.0 /100 | #327 | Tragic 22.8% |
| Dominicans | 0.0 /100 | #328 | Tragic 23.7% |
| Kiowa | 0.0 /100 | #329 | Tragic 23.7% |
| Immigrants | Dominican Republic | 0.0 /100 | #330 | Tragic 23.8% |
| Apache | 0.0 /100 | #331 | Tragic 23.8% |
| Natives/Alaskans | 0.0 /100 | #332 | Tragic 24.0% |
| Blacks/African Americans | 0.0 /100 | #333 | Tragic 24.7% |
| Menominee | 0.0 /100 | #334 | Tragic 25.0% |
| Pueblo | 0.0 /100 | #335 | Tragic 25.2% |
| Sioux | 0.0 /100 | #336 | Tragic 25.6% |
| Yup'ik | 0.0 /100 | #337 | Tragic 25.8% |
| Cheyenne | 0.0 /100 | #338 | Tragic 26.3% |
| Crow | 0.0 /100 | #339 | Tragic 26.4% |
Demographics Similar to Immigrants from Bulgaria by Child Poverty Among Girls Under 16
In terms of child poverty among girls under 16, the demographic groups most similar to Immigrants from Bulgaria are Zimbabwean (14.4%, a difference of 0.060%), Immigrants from Serbia (14.4%, a difference of 0.090%), Immigrants from Indonesia (14.4%, a difference of 0.13%), Immigrants from Romania (14.3%, a difference of 0.21%), and Estonian (14.3%, a difference of 0.25%).
| Demographics | Rating | Rank | Child Poverty Among Girls Under 16 |
| Immigrants | Pakistan | 99.1 /100 | #51 | Exceptional 14.2% |
| Italians | 99.1 /100 | #52 | Exceptional 14.3% |
| Luxembourgers | 99.0 /100 | #53 | Exceptional 14.3% |
| Estonians | 98.9 /100 | #54 | Exceptional 14.3% |
| Immigrants | Romania | 98.9 /100 | #55 | Exceptional 14.3% |
| Immigrants | Indonesia | 98.9 /100 | #56 | Exceptional 14.4% |
| Immigrants | Serbia | 98.9 /100 | #57 | Exceptional 14.4% |
| Immigrants | Bulgaria | 98.8 /100 | #58 | Exceptional 14.4% |
| Zimbabweans | 98.8 /100 | #59 | Exceptional 14.4% |
| Poles | 98.7 /100 | #60 | Exceptional 14.4% |
| Cambodians | 98.7 /100 | #61 | Exceptional 14.4% |
| Scandinavians | 98.7 /100 | #62 | Exceptional 14.4% |
| Immigrants | Europe | 98.7 /100 | #63 | Exceptional 14.4% |
| Immigrants | Philippines | 98.6 /100 | #64 | Exceptional 14.4% |
| Immigrants | Sweden | 98.6 /100 | #65 | Exceptional 14.5% |