Moroccan vs Bhutanese Child Poverty Among Boys Under 16
COMPARE
Moroccan
Bhutanese
Child Poverty Among Boys Under 16
Child Poverty Among Boys Under 16 Comparison
Moroccans
Bhutanese
17.7%
CHILD POVERTY AMONG BOYS UNDER 16
5.6/ 100
METRIC RATING
216th/ 347
METRIC RANK
12.6%
CHILD POVERTY AMONG BOYS UNDER 16
100.0/ 100
METRIC RATING
10th/ 347
METRIC RANK
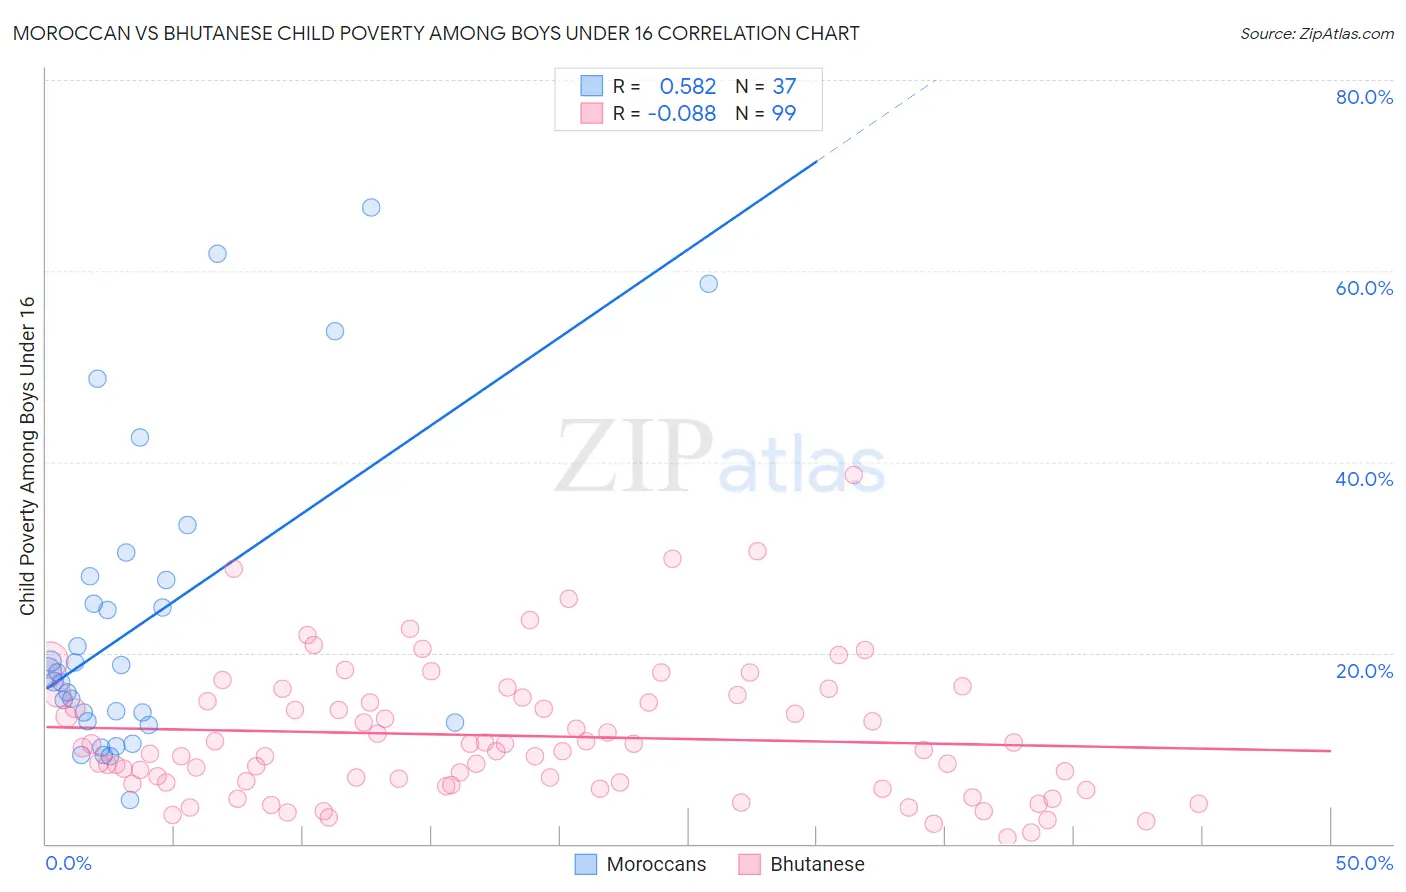
Moroccan vs Bhutanese Child Poverty Among Boys Under 16 Correlation Chart
The statistical analysis conducted on geographies consisting of 200,157,995 people shows a substantial positive correlation between the proportion of Moroccans and poverty level among boys under the age of 16 in the United States with a correlation coefficient (R) of 0.582 and weighted average of 17.7%. Similarly, the statistical analysis conducted on geographies consisting of 446,468,872 people shows a slight negative correlation between the proportion of Bhutanese and poverty level among boys under the age of 16 in the United States with a correlation coefficient (R) of -0.088 and weighted average of 12.6%, a difference of 40.8%.
Child Poverty Among Boys Under 16 Correlation Summary
| Measurement | Moroccan | Bhutanese |
| Minimum | 4.6% | 0.70% |
| Maximum | 66.7% | 38.6% |
| Range | 62.1% | 37.9% |
| Mean | 23.3% | 11.3% |
| Median | 17.9% | 9.8% |
| Interquartile 25% (IQ1) | 12.8% | 6.3% |
| Interquartile 75% (IQ3) | 27.8% | 15.3% |
| Interquartile Range (IQR) | 15.1% | 9.0% |
| Standard Deviation (Sample) | 16.0% | 7.1% |
| Standard Deviation (Population) | 15.8% | 7.0% |
Similar Demographics by Child Poverty Among Boys Under 16
Demographics Similar to Moroccans by Child Poverty Among Boys Under 16
In terms of child poverty among boys under 16, the demographic groups most similar to Moroccans are Japanese (17.7%, a difference of 0.030%), Iraqi (17.7%, a difference of 0.050%), Osage (17.7%, a difference of 0.090%), Sierra Leonean (17.8%, a difference of 0.13%), and Panamanian (17.7%, a difference of 0.16%).
| Demographics | Rating | Rank | Child Poverty Among Boys Under 16 |
| Alaskan Athabascans | 7.3 /100 | #209 | Tragic 17.6% |
| Immigrants | Armenia | 6.8 /100 | #210 | Tragic 17.6% |
| Immigrants | Immigrants | 6.7 /100 | #211 | Tragic 17.6% |
| Aleuts | 6.6 /100 | #212 | Tragic 17.7% |
| Immigrants | Eastern Africa | 6.0 /100 | #213 | Tragic 17.7% |
| Panamanians | 5.9 /100 | #214 | Tragic 17.7% |
| Osage | 5.8 /100 | #215 | Tragic 17.7% |
| Moroccans | 5.6 /100 | #216 | Tragic 17.7% |
| Japanese | 5.5 /100 | #217 | Tragic 17.7% |
| Iraqis | 5.5 /100 | #218 | Tragic 17.7% |
| Sierra Leoneans | 5.3 /100 | #219 | Tragic 17.8% |
| Immigrants | Cambodia | 5.1 /100 | #220 | Tragic 17.8% |
| Immigrants | Panama | 4.3 /100 | #221 | Tragic 17.9% |
| Pennsylvania Germans | 3.9 /100 | #222 | Tragic 17.9% |
| Cubans | 3.8 /100 | #223 | Tragic 17.9% |
Demographics Similar to Bhutanese by Child Poverty Among Boys Under 16
In terms of child poverty among boys under 16, the demographic groups most similar to Bhutanese are Immigrants from Iran (12.5%, a difference of 0.36%), Immigrants from South Central Asia (12.7%, a difference of 0.52%), Immigrants from Singapore (12.5%, a difference of 0.86%), Iranian (12.4%, a difference of 1.2%), and Immigrants from Hong Kong (12.3%, a difference of 2.8%).
| Demographics | Rating | Rank | Child Poverty Among Boys Under 16 |
| Filipinos | 100.0 /100 | #3 | Exceptional 11.1% |
| Thais | 100.0 /100 | #4 | Exceptional 11.7% |
| Chinese | 100.0 /100 | #5 | Exceptional 11.9% |
| Immigrants | Hong Kong | 100.0 /100 | #6 | Exceptional 12.3% |
| Iranians | 100.0 /100 | #7 | Exceptional 12.4% |
| Immigrants | Singapore | 100.0 /100 | #8 | Exceptional 12.5% |
| Immigrants | Iran | 100.0 /100 | #9 | Exceptional 12.5% |
| Bhutanese | 100.0 /100 | #10 | Exceptional 12.6% |
| Immigrants | South Central Asia | 100.0 /100 | #11 | Exceptional 12.7% |
| Burmese | 99.9 /100 | #12 | Exceptional 13.0% |
| Immigrants | Korea | 99.9 /100 | #13 | Exceptional 13.0% |
| Immigrants | Ireland | 99.9 /100 | #14 | Exceptional 13.1% |
| Immigrants | Japan | 99.9 /100 | #15 | Exceptional 13.1% |
| Maltese | 99.9 /100 | #16 | Exceptional 13.2% |
| Norwegians | 99.9 /100 | #17 | Exceptional 13.2% |