Mexican American Indian vs Iroquois Female Poverty Among 25-34 Year Olds
COMPARE
Mexican American Indian
Iroquois
Female Poverty Among 25-34 Year Olds
Female Poverty Among 25-34 Year Olds Comparison
Mexican American Indians
Iroquois
15.4%
FEMALE POVERTY AMONG 25-34 YEAR OLDS
0.2/ 100
METRIC RATING
263rd/ 347
METRIC RANK
17.5%
FEMALE POVERTY AMONG 25-34 YEAR OLDS
0.0/ 100
METRIC RATING
312th/ 347
METRIC RANK
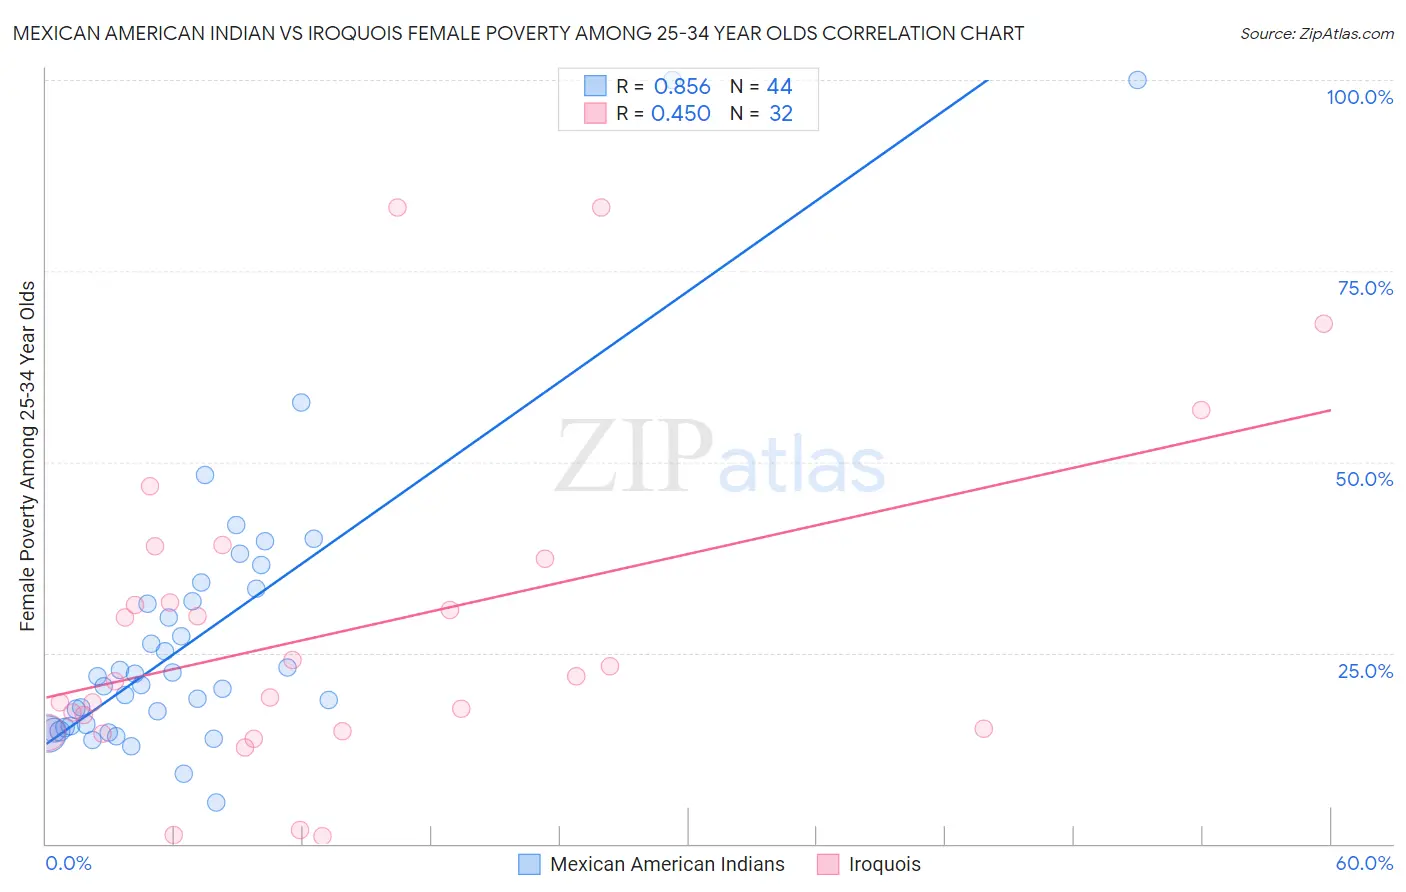
Mexican American Indian vs Iroquois Female Poverty Among 25-34 Year Olds Correlation Chart
The statistical analysis conducted on geographies consisting of 315,662,807 people shows a very strong positive correlation between the proportion of Mexican American Indians and poverty level among females between the ages 25 and 34 in the United States with a correlation coefficient (R) of 0.856 and weighted average of 15.4%. Similarly, the statistical analysis conducted on geographies consisting of 205,419,600 people shows a moderate positive correlation between the proportion of Iroquois and poverty level among females between the ages 25 and 34 in the United States with a correlation coefficient (R) of 0.450 and weighted average of 17.5%, a difference of 13.7%.
Female Poverty Among 25-34 Year Olds Correlation Summary
| Measurement | Mexican American Indian | Iroquois |
| Minimum | 5.3% | 0.99% |
| Maximum | 100.0% | 83.3% |
| Range | 94.7% | 82.3% |
| Mean | 27.2% | 27.9% |
| Median | 21.4% | 21.5% |
| Interquartile 25% (IQ1) | 15.4% | 14.8% |
| Interquartile 75% (IQ3) | 32.6% | 34.5% |
| Interquartile Range (IQR) | 17.2% | 19.6% |
| Standard Deviation (Sample) | 19.4% | 20.7% |
| Standard Deviation (Population) | 19.2% | 20.4% |
Similar Demographics by Female Poverty Among 25-34 Year Olds
Demographics Similar to Mexican American Indians by Female Poverty Among 25-34 Year Olds
In terms of female poverty among 25-34 year olds, the demographic groups most similar to Mexican American Indians are Immigrants from Belize (15.3%, a difference of 0.24%), Liberian (15.3%, a difference of 0.28%), Pennsylvania German (15.4%, a difference of 0.43%), Immigrants from Liberia (15.4%, a difference of 0.47%), and Immigrants from Somalia (15.4%, a difference of 0.48%).
| Demographics | Rating | Rank | Female Poverty Among 25-34 Year Olds |
| West Indians | 0.3 /100 | #256 | Tragic 15.2% |
| Immigrants | Burma/Myanmar | 0.3 /100 | #257 | Tragic 15.2% |
| Nepalese | 0.2 /100 | #258 | Tragic 15.2% |
| Immigrants | Cuba | 0.2 /100 | #259 | Tragic 15.2% |
| Marshallese | 0.2 /100 | #260 | Tragic 15.3% |
| Liberians | 0.2 /100 | #261 | Tragic 15.3% |
| Immigrants | Belize | 0.2 /100 | #262 | Tragic 15.3% |
| Mexican American Indians | 0.2 /100 | #263 | Tragic 15.4% |
| Pennsylvania Germans | 0.1 /100 | #264 | Tragic 15.4% |
| Immigrants | Liberia | 0.1 /100 | #265 | Tragic 15.4% |
| Immigrants | Somalia | 0.1 /100 | #266 | Tragic 15.4% |
| Central Americans | 0.1 /100 | #267 | Tragic 15.5% |
| Immigrants | Senegal | 0.1 /100 | #268 | Tragic 15.6% |
| Sub-Saharan Africans | 0.1 /100 | #269 | Tragic 15.6% |
| British West Indians | 0.1 /100 | #270 | Tragic 15.6% |
Demographics Similar to Iroquois by Female Poverty Among 25-34 Year Olds
In terms of female poverty among 25-34 year olds, the demographic groups most similar to Iroquois are Colville (17.5%, a difference of 0.080%), Immigrants from Dominican Republic (17.6%, a difference of 0.76%), Yakama (17.6%, a difference of 0.98%), Dominican (17.6%, a difference of 0.98%), and Immigrants from Honduras (17.3%, a difference of 1.1%).
| Demographics | Rating | Rank | Female Poverty Among 25-34 Year Olds |
| Immigrants | Cabo Verde | 0.0 /100 | #305 | Tragic 16.9% |
| Chickasaw | 0.0 /100 | #306 | Tragic 17.0% |
| Yaqui | 0.0 /100 | #307 | Tragic 17.0% |
| Africans | 0.0 /100 | #308 | Tragic 17.0% |
| Ottawa | 0.0 /100 | #309 | Tragic 17.1% |
| Cherokee | 0.0 /100 | #310 | Tragic 17.2% |
| Immigrants | Honduras | 0.0 /100 | #311 | Tragic 17.3% |
| Iroquois | 0.0 /100 | #312 | Tragic 17.5% |
| Colville | 0.0 /100 | #313 | Tragic 17.5% |
| Immigrants | Dominican Republic | 0.0 /100 | #314 | Tragic 17.6% |
| Yakama | 0.0 /100 | #315 | Tragic 17.6% |
| Dominicans | 0.0 /100 | #316 | Tragic 17.6% |
| Arapaho | 0.0 /100 | #317 | Tragic 17.8% |
| Ute | 0.0 /100 | #318 | Tragic 17.9% |
| Menominee | 0.0 /100 | #319 | Tragic 18.0% |