Mexican American Indian vs Immigrants from Bangladesh Female Poverty Among 25-34 Year Olds
COMPARE
Mexican American Indian
Immigrants from Bangladesh
Female Poverty Among 25-34 Year Olds
Female Poverty Among 25-34 Year Olds Comparison
Mexican American Indians
Immigrants from Bangladesh
15.4%
FEMALE POVERTY AMONG 25-34 YEAR OLDS
0.2/ 100
METRIC RATING
263rd/ 347
METRIC RANK
14.8%
FEMALE POVERTY AMONG 25-34 YEAR OLDS
1.1/ 100
METRIC RATING
244th/ 347
METRIC RANK
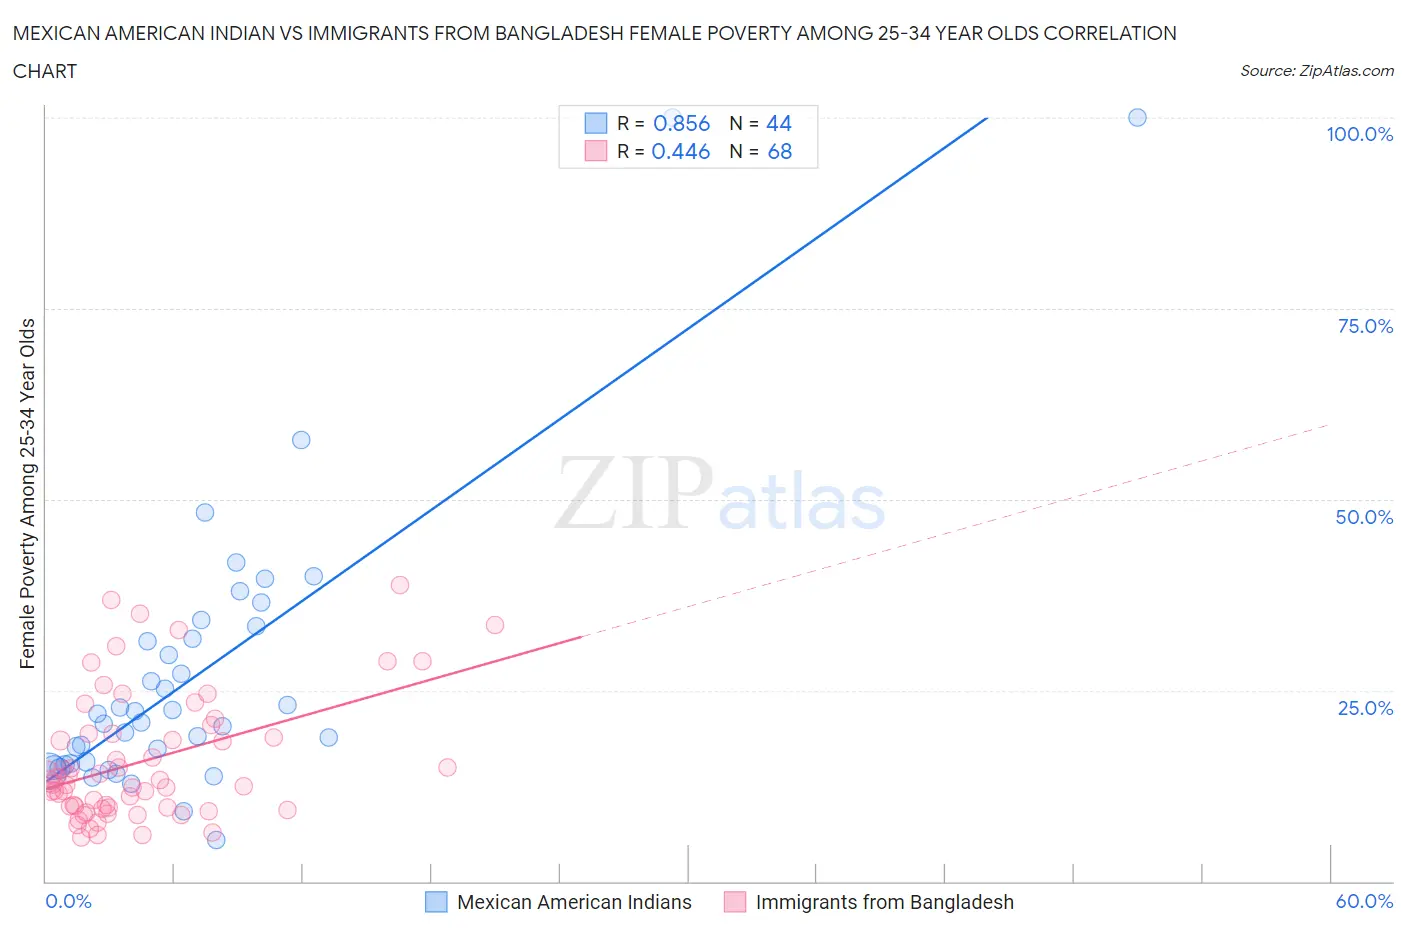
Mexican American Indian vs Immigrants from Bangladesh Female Poverty Among 25-34 Year Olds Correlation Chart
The statistical analysis conducted on geographies consisting of 315,662,807 people shows a very strong positive correlation between the proportion of Mexican American Indians and poverty level among females between the ages 25 and 34 in the United States with a correlation coefficient (R) of 0.856 and weighted average of 15.4%. Similarly, the statistical analysis conducted on geographies consisting of 202,108,312 people shows a moderate positive correlation between the proportion of Immigrants from Bangladesh and poverty level among females between the ages 25 and 34 in the United States with a correlation coefficient (R) of 0.446 and weighted average of 14.8%, a difference of 3.8%.
Female Poverty Among 25-34 Year Olds Correlation Summary
| Measurement | Mexican American Indian | Immigrants from Bangladesh |
| Minimum | 5.3% | 5.7% |
| Maximum | 100.0% | 38.8% |
| Range | 94.7% | 33.0% |
| Mean | 27.2% | 15.8% |
| Median | 21.4% | 12.9% |
| Interquartile 25% (IQ1) | 15.4% | 9.6% |
| Interquartile 75% (IQ3) | 32.6% | 19.2% |
| Interquartile Range (IQR) | 17.2% | 9.6% |
| Standard Deviation (Sample) | 19.4% | 8.3% |
| Standard Deviation (Population) | 19.2% | 8.2% |
Demographics Similar to Mexican American Indians and Immigrants from Bangladesh by Female Poverty Among 25-34 Year Olds
In terms of female poverty among 25-34 year olds, the demographic groups most similar to Mexican American Indians are Immigrants from Belize (15.3%, a difference of 0.24%), Liberian (15.3%, a difference of 0.28%), Marshallese (15.3%, a difference of 0.50%), Immigrants from Cuba (15.2%, a difference of 0.87%), and Nepalese (15.2%, a difference of 0.89%). Similarly, the demographic groups most similar to Immigrants from Bangladesh are Immigrants from Nicaragua (14.8%, a difference of 0.010%), Immigrants from Middle Africa (14.8%, a difference of 0.18%), Jamaican (14.8%, a difference of 0.22%), German Russian (14.9%, a difference of 0.56%), and Immigrants from Western Africa (14.9%, a difference of 0.60%).
| Demographics | Rating | Rank | Female Poverty Among 25-34 Year Olds |
| Immigrants | Nicaragua | 1.1 /100 | #243 | Tragic 14.8% |
| Immigrants | Bangladesh | 1.1 /100 | #244 | Tragic 14.8% |
| Immigrants | Middle Africa | 1.0 /100 | #245 | Tragic 14.8% |
| Jamaicans | 1.0 /100 | #246 | Tragic 14.8% |
| German Russians | 0.8 /100 | #247 | Tragic 14.9% |
| Immigrants | Western Africa | 0.8 /100 | #248 | Tragic 14.9% |
| Immigrants | Haiti | 0.5 /100 | #249 | Tragic 15.0% |
| Immigrants | El Salvador | 0.5 /100 | #250 | Tragic 15.0% |
| Haitians | 0.5 /100 | #251 | Tragic 15.0% |
| Belizeans | 0.4 /100 | #252 | Tragic 15.1% |
| Immigrants | West Indies | 0.4 /100 | #253 | Tragic 15.1% |
| Somalis | 0.4 /100 | #254 | Tragic 15.1% |
| Immigrants | Laos | 0.3 /100 | #255 | Tragic 15.2% |
| West Indians | 0.3 /100 | #256 | Tragic 15.2% |
| Immigrants | Burma/Myanmar | 0.3 /100 | #257 | Tragic 15.2% |
| Nepalese | 0.2 /100 | #258 | Tragic 15.2% |
| Immigrants | Cuba | 0.2 /100 | #259 | Tragic 15.2% |
| Marshallese | 0.2 /100 | #260 | Tragic 15.3% |
| Liberians | 0.2 /100 | #261 | Tragic 15.3% |
| Immigrants | Belize | 0.2 /100 | #262 | Tragic 15.3% |
| Mexican American Indians | 0.2 /100 | #263 | Tragic 15.4% |