Menominee vs Immigrants from England Male Poverty
COMPARE
Menominee
Immigrants from England
Male Poverty
Male Poverty Comparison
Menominee
Immigrants from England
15.3%
MALE POVERTY
0.0/ 100
METRIC RATING
324th/ 347
METRIC RANK
10.4%
MALE POVERTY
95.5/ 100
METRIC RATING
85th/ 347
METRIC RANK
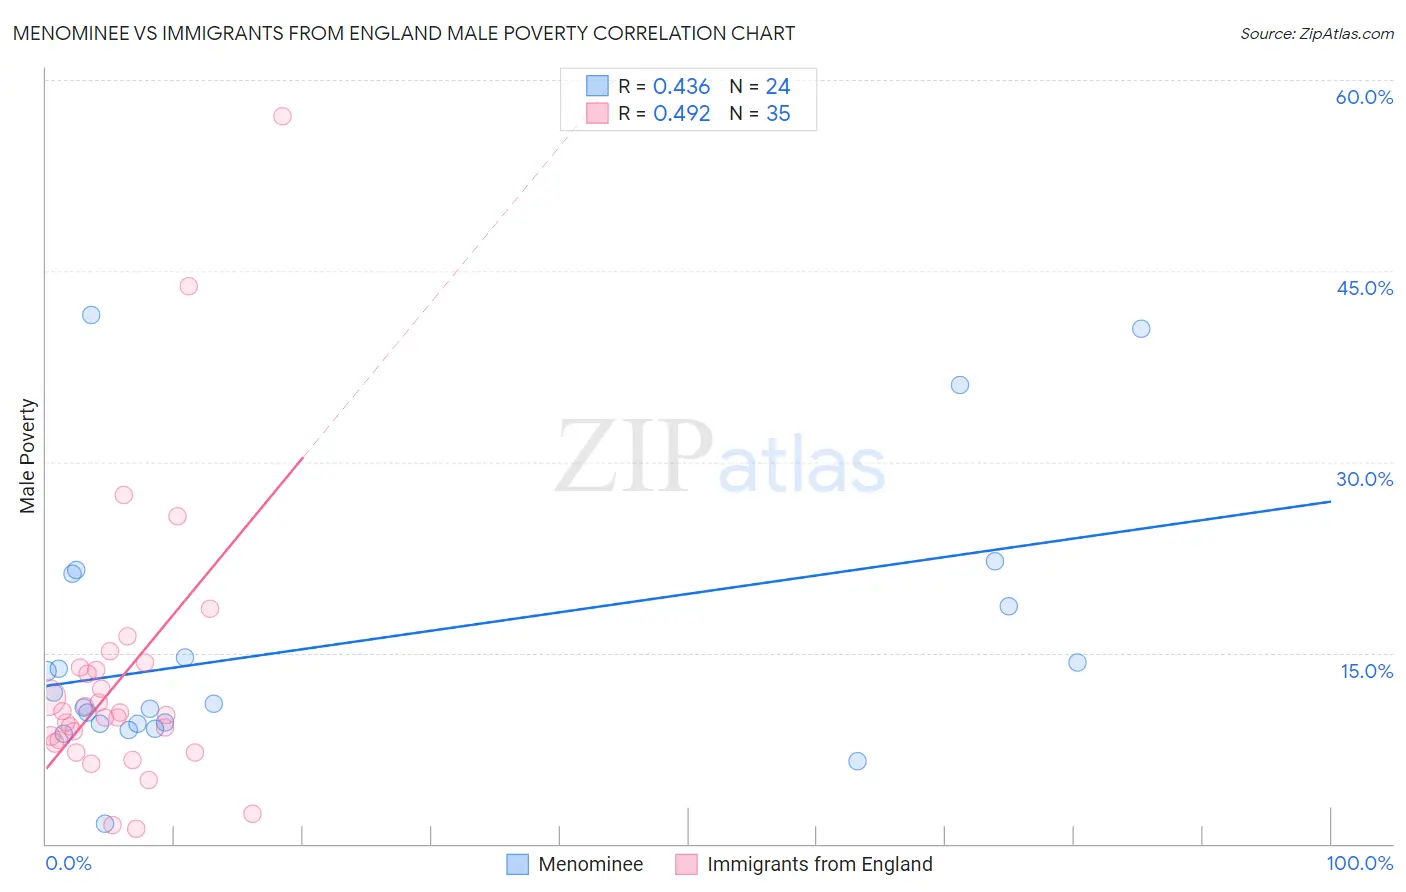
Menominee vs Immigrants from England Male Poverty Correlation Chart
The statistical analysis conducted on geographies consisting of 45,777,105 people shows a moderate positive correlation between the proportion of Menominee and poverty level among males in the United States with a correlation coefficient (R) of 0.436 and weighted average of 15.3%. Similarly, the statistical analysis conducted on geographies consisting of 391,609,977 people shows a moderate positive correlation between the proportion of Immigrants from England and poverty level among males in the United States with a correlation coefficient (R) of 0.492 and weighted average of 10.4%, a difference of 47.6%.
Male Poverty Correlation Summary
| Measurement | Menominee | Immigrants from England |
| Minimum | 1.6% | 1.2% |
| Maximum | 41.6% | 57.1% |
| Range | 40.0% | 55.9% |
| Mean | 15.6% | 13.0% |
| Median | 11.5% | 10.2% |
| Interquartile 25% (IQ1) | 9.4% | 7.9% |
| Interquartile 75% (IQ3) | 19.9% | 13.9% |
| Interquartile Range (IQR) | 10.5% | 5.9% |
| Standard Deviation (Sample) | 10.4% | 11.0% |
| Standard Deviation (Population) | 10.2% | 10.8% |
Similar Demographics by Male Poverty
Demographics Similar to Menominee by Male Poverty
In terms of male poverty, the demographic groups most similar to Menominee are Yakama (15.3%, a difference of 0.18%), Colville (15.2%, a difference of 0.19%), Central American Indian (15.3%, a difference of 0.29%), Kiowa (15.2%, a difference of 0.58%), and Arapaho (15.1%, a difference of 1.3%).
| Demographics | Rating | Rank | Male Poverty |
| Immigrants | Dominica | 0.0 /100 | #317 | Tragic 14.7% |
| Immigrants | Grenada | 0.0 /100 | #318 | Tragic 14.7% |
| U.S. Virgin Islanders | 0.0 /100 | #319 | Tragic 14.7% |
| Immigrants | Congo | 0.0 /100 | #320 | Tragic 14.7% |
| Arapaho | 0.0 /100 | #321 | Tragic 15.1% |
| Kiowa | 0.0 /100 | #322 | Tragic 15.2% |
| Colville | 0.0 /100 | #323 | Tragic 15.2% |
| Menominee | 0.0 /100 | #324 | Tragic 15.3% |
| Yakama | 0.0 /100 | #325 | Tragic 15.3% |
| Central American Indians | 0.0 /100 | #326 | Tragic 15.3% |
| Paiute | 0.0 /100 | #327 | Tragic 15.8% |
| Blacks/African Americans | 0.0 /100 | #328 | Tragic 15.8% |
| Dominicans | 0.0 /100 | #329 | Tragic 16.1% |
| Immigrants | Dominican Republic | 0.0 /100 | #330 | Tragic 16.2% |
| Ute | 0.0 /100 | #331 | Tragic 16.2% |
Demographics Similar to Immigrants from England by Male Poverty
In terms of male poverty, the demographic groups most similar to Immigrants from England are Czechoslovakian (10.3%, a difference of 0.050%), Immigrants from Sweden (10.3%, a difference of 0.11%), Immigrants from Eastern Asia (10.4%, a difference of 0.13%), Northern European (10.4%, a difference of 0.17%), and Egyptian (10.3%, a difference of 0.23%).
| Demographics | Rating | Rank | Male Poverty |
| Irish | 96.8 /100 | #78 | Exceptional 10.3% |
| Immigrants | North America | 96.5 /100 | #79 | Exceptional 10.3% |
| English | 96.4 /100 | #80 | Exceptional 10.3% |
| Belgians | 95.9 /100 | #81 | Exceptional 10.3% |
| Egyptians | 95.9 /100 | #82 | Exceptional 10.3% |
| Immigrants | Sweden | 95.7 /100 | #83 | Exceptional 10.3% |
| Czechoslovakians | 95.6 /100 | #84 | Exceptional 10.3% |
| Immigrants | England | 95.5 /100 | #85 | Exceptional 10.4% |
| Immigrants | Eastern Asia | 95.3 /100 | #86 | Exceptional 10.4% |
| Northern Europeans | 95.2 /100 | #87 | Exceptional 10.4% |
| Cambodians | 95.0 /100 | #88 | Exceptional 10.4% |
| Immigrants | Denmark | 95.0 /100 | #89 | Exceptional 10.4% |
| Indians (Asian) | 94.9 /100 | #90 | Exceptional 10.4% |
| British | 94.8 /100 | #91 | Exceptional 10.4% |
| Jordanians | 94.4 /100 | #92 | Exceptional 10.4% |