Menominee vs Immigrants from Colombia Male Poverty
COMPARE
Menominee
Immigrants from Colombia
Male Poverty
Male Poverty Comparison
Menominee
Immigrants from Colombia
15.3%
MALE POVERTY
0.0/ 100
METRIC RATING
324th/ 347
METRIC RANK
11.1%
MALE POVERTY
54.2/ 100
METRIC RATING
169th/ 347
METRIC RANK
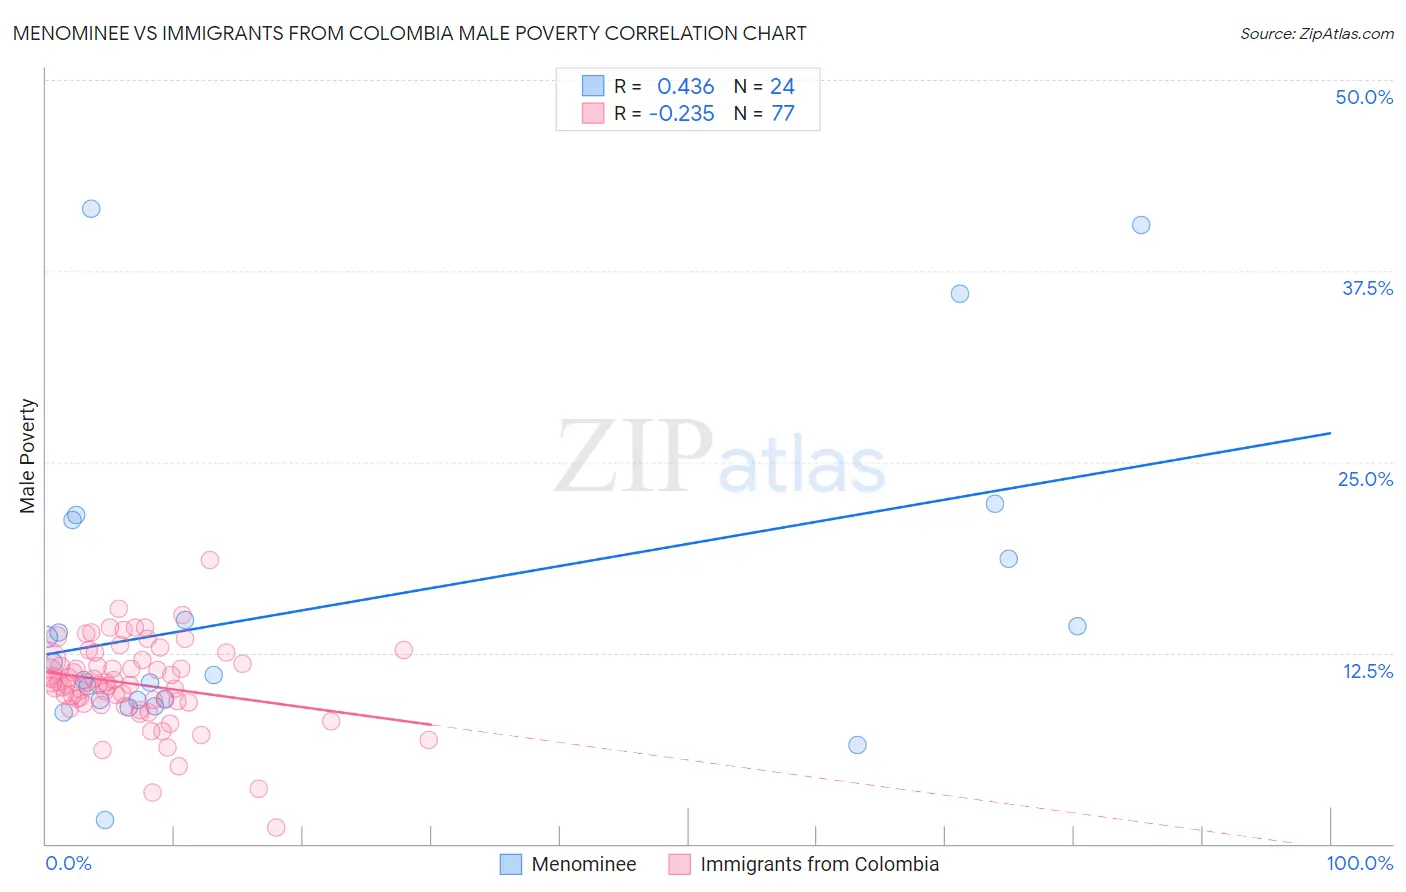
Menominee vs Immigrants from Colombia Male Poverty Correlation Chart
The statistical analysis conducted on geographies consisting of 45,777,105 people shows a moderate positive correlation between the proportion of Menominee and poverty level among males in the United States with a correlation coefficient (R) of 0.436 and weighted average of 15.3%. Similarly, the statistical analysis conducted on geographies consisting of 378,363,943 people shows a weak negative correlation between the proportion of Immigrants from Colombia and poverty level among males in the United States with a correlation coefficient (R) of -0.235 and weighted average of 11.1%, a difference of 37.1%.
Male Poverty Correlation Summary
| Measurement | Menominee | Immigrants from Colombia |
| Minimum | 1.6% | 1.0% |
| Maximum | 41.6% | 18.6% |
| Range | 40.0% | 17.5% |
| Mean | 15.6% | 10.4% |
| Median | 11.5% | 10.5% |
| Interquartile 25% (IQ1) | 9.4% | 9.2% |
| Interquartile 75% (IQ3) | 19.9% | 12.0% |
| Interquartile Range (IQR) | 10.5% | 2.8% |
| Standard Deviation (Sample) | 10.4% | 2.8% |
| Standard Deviation (Population) | 10.2% | 2.8% |
Similar Demographics by Male Poverty
Demographics Similar to Menominee by Male Poverty
In terms of male poverty, the demographic groups most similar to Menominee are Yakama (15.3%, a difference of 0.18%), Colville (15.2%, a difference of 0.19%), Central American Indian (15.3%, a difference of 0.29%), Kiowa (15.2%, a difference of 0.58%), and Arapaho (15.1%, a difference of 1.3%).
| Demographics | Rating | Rank | Male Poverty |
| Immigrants | Dominica | 0.0 /100 | #317 | Tragic 14.7% |
| Immigrants | Grenada | 0.0 /100 | #318 | Tragic 14.7% |
| U.S. Virgin Islanders | 0.0 /100 | #319 | Tragic 14.7% |
| Immigrants | Congo | 0.0 /100 | #320 | Tragic 14.7% |
| Arapaho | 0.0 /100 | #321 | Tragic 15.1% |
| Kiowa | 0.0 /100 | #322 | Tragic 15.2% |
| Colville | 0.0 /100 | #323 | Tragic 15.2% |
| Menominee | 0.0 /100 | #324 | Tragic 15.3% |
| Yakama | 0.0 /100 | #325 | Tragic 15.3% |
| Central American Indians | 0.0 /100 | #326 | Tragic 15.3% |
| Paiute | 0.0 /100 | #327 | Tragic 15.8% |
| Blacks/African Americans | 0.0 /100 | #328 | Tragic 15.8% |
| Dominicans | 0.0 /100 | #329 | Tragic 16.1% |
| Immigrants | Dominican Republic | 0.0 /100 | #330 | Tragic 16.2% |
| Ute | 0.0 /100 | #331 | Tragic 16.2% |
Demographics Similar to Immigrants from Colombia by Male Poverty
In terms of male poverty, the demographic groups most similar to Immigrants from Colombia are South American (11.1%, a difference of 0.040%), Immigrants from Portugal (11.1%, a difference of 0.070%), Hungarian (11.1%, a difference of 0.090%), Immigrants from Albania (11.1%, a difference of 0.11%), and Immigrants from Spain (11.1%, a difference of 0.13%).
| Demographics | Rating | Rank | Male Poverty |
| Immigrants | Chile | 57.4 /100 | #162 | Average 11.1% |
| Whites/Caucasians | 56.7 /100 | #163 | Average 11.1% |
| Ethiopians | 56.7 /100 | #164 | Average 11.1% |
| Immigrants | Spain | 55.5 /100 | #165 | Average 11.1% |
| Immigrants | Albania | 55.3 /100 | #166 | Average 11.1% |
| Hungarians | 55.1 /100 | #167 | Average 11.1% |
| Immigrants | Portugal | 54.9 /100 | #168 | Average 11.1% |
| Immigrants | Colombia | 54.2 /100 | #169 | Average 11.1% |
| South Americans | 53.8 /100 | #170 | Average 11.1% |
| Uruguayans | 51.0 /100 | #171 | Average 11.2% |
| Immigrants | Ethiopia | 50.7 /100 | #172 | Average 11.2% |
| Pennsylvania Germans | 50.5 /100 | #173 | Average 11.2% |
| Immigrants | Oceania | 50.0 /100 | #174 | Average 11.2% |
| Celtics | 47.5 /100 | #175 | Average 11.2% |
| Immigrants | Fiji | 46.0 /100 | #176 | Average 11.2% |