Marshallese vs Yugoslavian Family Poverty
COMPARE
Marshallese
Yugoslavian
Family Poverty
Family Poverty Comparison
Marshallese
Yugoslavians
9.9%
FAMILY POVERTY
3.9/ 100
METRIC RATING
224th/ 347
METRIC RANK
8.5%
FAMILY POVERTY
83.5/ 100
METRIC RATING
142nd/ 347
METRIC RANK
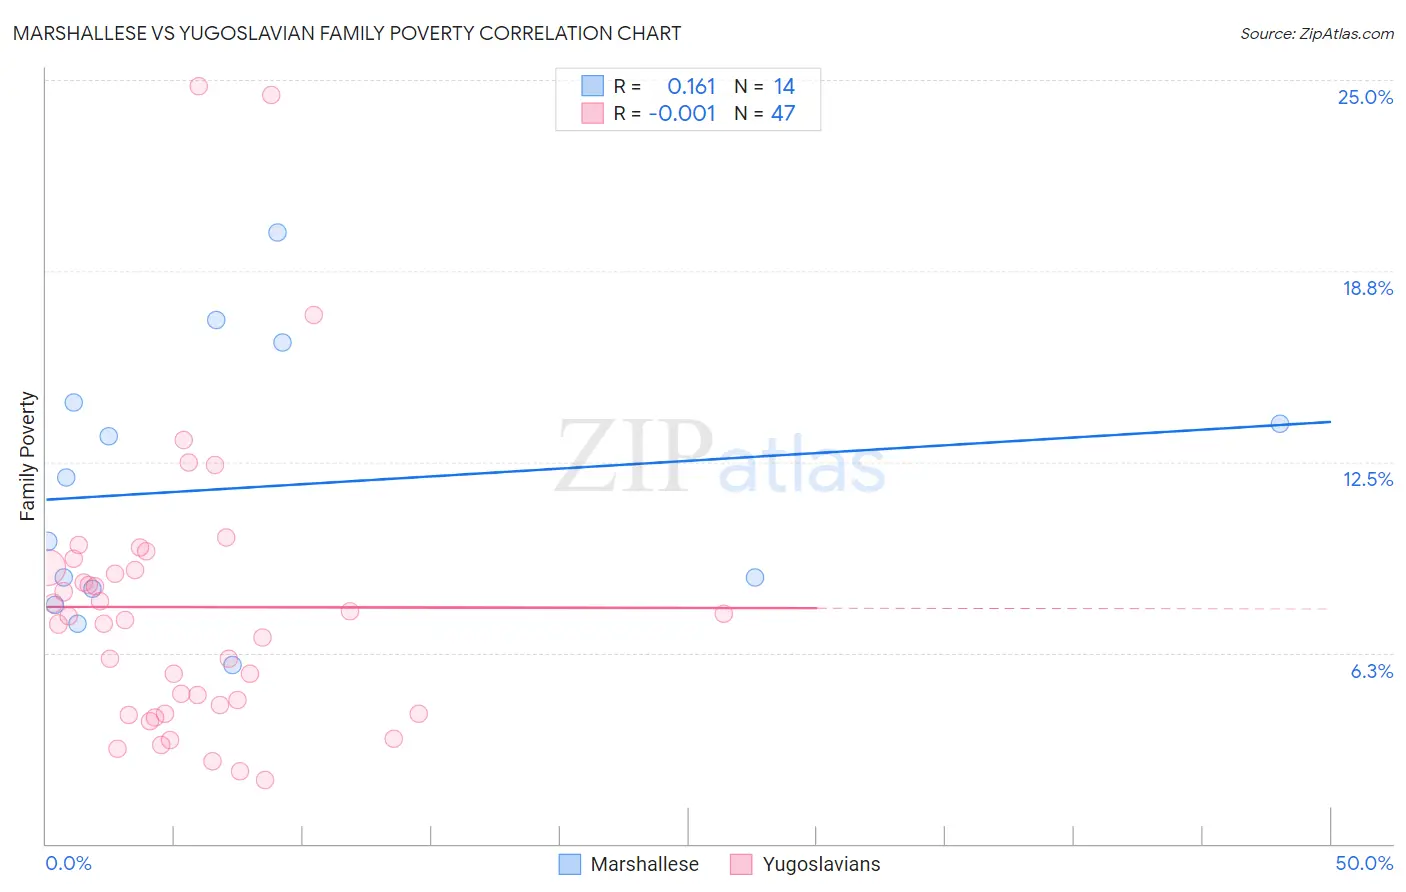
Marshallese vs Yugoslavian Family Poverty Correlation Chart
The statistical analysis conducted on geographies consisting of 14,754,460 people shows a poor positive correlation between the proportion of Marshallese and poverty level among families in the United States with a correlation coefficient (R) of 0.161 and weighted average of 9.9%. Similarly, the statistical analysis conducted on geographies consisting of 285,303,830 people shows no correlation between the proportion of Yugoslavians and poverty level among families in the United States with a correlation coefficient (R) of -0.001 and weighted average of 8.5%, a difference of 16.6%.
Family Poverty Correlation Summary
| Measurement | Marshallese | Yugoslavian |
| Minimum | 5.8% | 2.1% |
| Maximum | 20.0% | 24.8% |
| Range | 14.2% | 22.7% |
| Mean | 11.7% | 7.7% |
| Median | 10.9% | 7.3% |
| Interquartile 25% (IQ1) | 8.3% | 4.3% |
| Interquartile 75% (IQ3) | 14.5% | 9.0% |
| Interquartile Range (IQR) | 6.1% | 4.8% |
| Standard Deviation (Sample) | 4.3% | 4.8% |
| Standard Deviation (Population) | 4.1% | 4.7% |
Similar Demographics by Family Poverty
Demographics Similar to Marshallese by Family Poverty
In terms of family poverty, the demographic groups most similar to Marshallese are Immigrants (10.0%, a difference of 0.25%), Immigrants from Africa (9.9%, a difference of 0.30%), Ottawa (10.0%, a difference of 0.52%), Immigrants from Armenia (10.0%, a difference of 0.54%), and Japanese (9.9%, a difference of 0.60%).
| Demographics | Rating | Rank | Family Poverty |
| Americans | 6.2 /100 | #217 | Tragic 9.8% |
| Panamanians | 5.6 /100 | #218 | Tragic 9.8% |
| Immigrants | Eritrea | 5.4 /100 | #219 | Tragic 9.9% |
| Bermudans | 5.3 /100 | #220 | Tragic 9.9% |
| Immigrants | Cambodia | 4.8 /100 | #221 | Tragic 9.9% |
| Japanese | 4.8 /100 | #222 | Tragic 9.9% |
| Immigrants | Africa | 4.3 /100 | #223 | Tragic 9.9% |
| Marshallese | 3.9 /100 | #224 | Tragic 9.9% |
| Immigrants | Immigrants | 3.6 /100 | #225 | Tragic 10.0% |
| Ottawa | 3.3 /100 | #226 | Tragic 10.0% |
| Immigrants | Armenia | 3.3 /100 | #227 | Tragic 10.0% |
| Sudanese | 3.1 /100 | #228 | Tragic 10.0% |
| Immigrants | Uzbekistan | 3.1 /100 | #229 | Tragic 10.0% |
| Immigrants | Panama | 3.1 /100 | #230 | Tragic 10.0% |
| Alaskan Athabascans | 2.7 /100 | #231 | Tragic 10.1% |
Demographics Similar to Yugoslavians by Family Poverty
In terms of family poverty, the demographic groups most similar to Yugoslavians are Immigrants from Germany (8.5%, a difference of 0.030%), Albanian (8.5%, a difference of 0.050%), Immigrants from South Eastern Asia (8.5%, a difference of 0.070%), Immigrants from Belarus (8.5%, a difference of 0.080%), and Immigrants from Ukraine (8.5%, a difference of 0.11%).
| Demographics | Rating | Rank | Family Poverty |
| Immigrants | Malaysia | 86.5 /100 | #135 | Excellent 8.5% |
| Immigrants | Brazil | 86.3 /100 | #136 | Excellent 8.5% |
| Immigrants | Southern Europe | 86.0 /100 | #137 | Excellent 8.5% |
| Armenians | 84.6 /100 | #138 | Excellent 8.5% |
| Immigrants | Nepal | 84.2 /100 | #139 | Excellent 8.5% |
| Immigrants | Kazakhstan | 84.1 /100 | #140 | Excellent 8.5% |
| Immigrants | Ukraine | 83.9 /100 | #141 | Excellent 8.5% |
| Yugoslavians | 83.5 /100 | #142 | Excellent 8.5% |
| Immigrants | Germany | 83.3 /100 | #143 | Excellent 8.5% |
| Albanians | 83.3 /100 | #144 | Excellent 8.5% |
| Immigrants | South Eastern Asia | 83.2 /100 | #145 | Excellent 8.5% |
| Immigrants | Belarus | 83.2 /100 | #146 | Excellent 8.5% |
| Immigrants | Jordan | 83.0 /100 | #147 | Excellent 8.5% |
| Scotch-Irish | 82.2 /100 | #148 | Excellent 8.6% |
| Mongolians | 80.4 /100 | #149 | Excellent 8.6% |