Crow vs Yugoslavian Family Poverty
COMPARE
Crow
Yugoslavian
Family Poverty
Family Poverty Comparison
Crow
Yugoslavians
16.1%
FAMILY POVERTY
0.0/ 100
METRIC RATING
338th/ 347
METRIC RANK
8.5%
FAMILY POVERTY
83.5/ 100
METRIC RATING
142nd/ 347
METRIC RANK
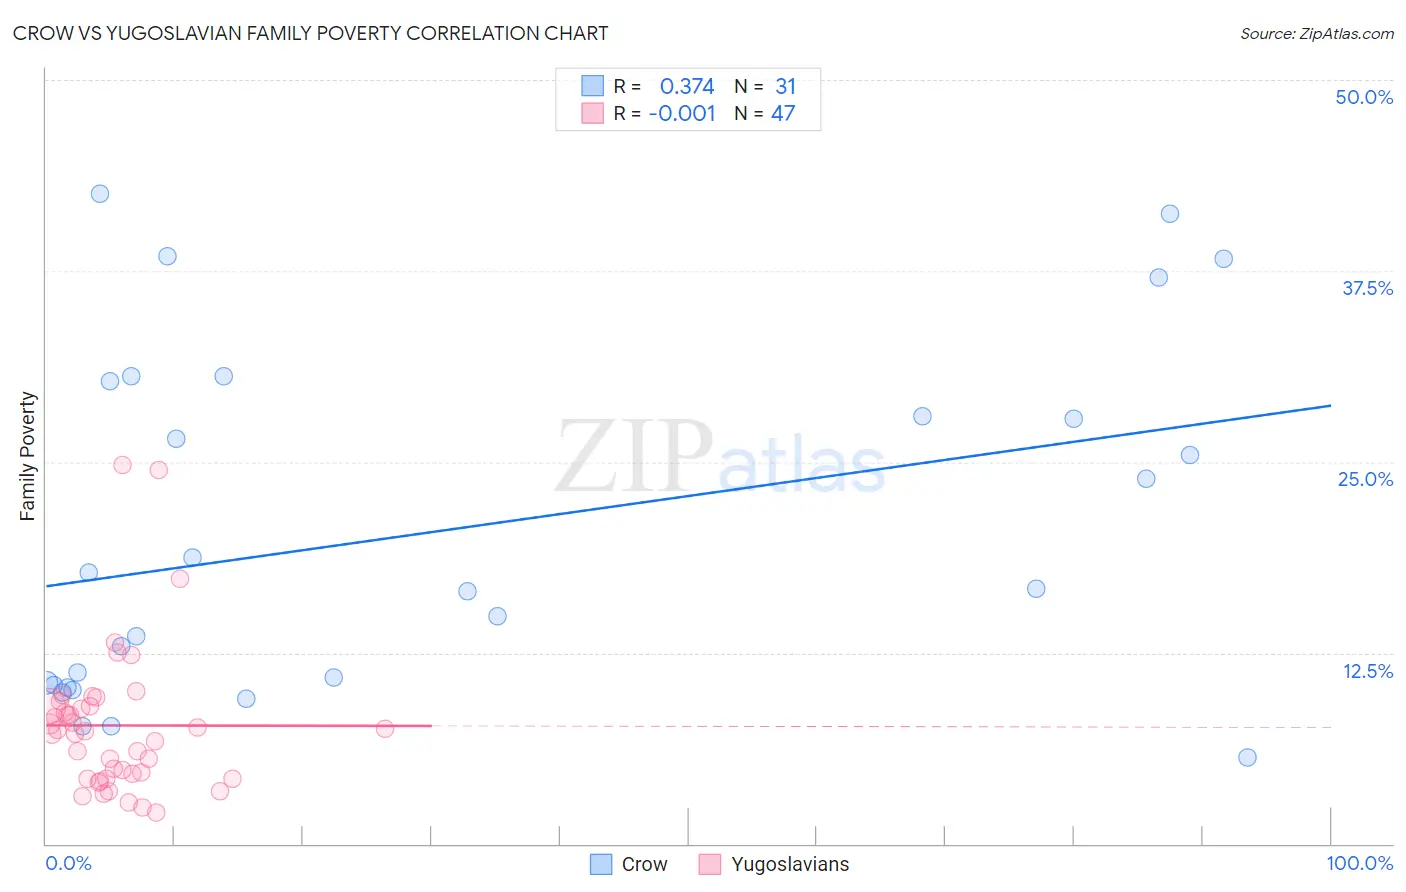
Crow vs Yugoslavian Family Poverty Correlation Chart
The statistical analysis conducted on geographies consisting of 59,176,312 people shows a mild positive correlation between the proportion of Crow and poverty level among families in the United States with a correlation coefficient (R) of 0.374 and weighted average of 16.1%. Similarly, the statistical analysis conducted on geographies consisting of 285,303,830 people shows no correlation between the proportion of Yugoslavians and poverty level among families in the United States with a correlation coefficient (R) of -0.001 and weighted average of 8.5%, a difference of 88.9%.
Family Poverty Correlation Summary
| Measurement | Crow | Yugoslavian |
| Minimum | 5.7% | 2.1% |
| Maximum | 42.6% | 24.8% |
| Range | 36.9% | 22.7% |
| Mean | 20.5% | 7.7% |
| Median | 16.7% | 7.3% |
| Interquartile 25% (IQ1) | 10.4% | 4.3% |
| Interquartile 75% (IQ3) | 30.3% | 9.0% |
| Interquartile Range (IQR) | 19.9% | 4.8% |
| Standard Deviation (Sample) | 11.4% | 4.8% |
| Standard Deviation (Population) | 11.2% | 4.7% |
Similar Demographics by Family Poverty
Demographics Similar to Crow by Family Poverty
In terms of family poverty, the demographic groups most similar to Crow are Hopi (15.9%, a difference of 1.1%), Sioux (15.9%, a difference of 1.6%), Yuman (16.6%, a difference of 3.3%), Pueblo (17.0%, a difference of 5.4%), and Lumbee (17.0%, a difference of 5.5%).
| Demographics | Rating | Rank | Family Poverty |
| Cheyenne | 0.0 /100 | #331 | Tragic 14.3% |
| Dominicans | 0.0 /100 | #332 | Tragic 14.3% |
| Immigrants | Dominican Republic | 0.0 /100 | #333 | Tragic 14.4% |
| Houma | 0.0 /100 | #334 | Tragic 14.6% |
| Apache | 0.0 /100 | #335 | Tragic 14.7% |
| Sioux | 0.0 /100 | #336 | Tragic 15.9% |
| Hopi | 0.0 /100 | #337 | Tragic 15.9% |
| Crow | 0.0 /100 | #338 | Tragic 16.1% |
| Yuman | 0.0 /100 | #339 | Tragic 16.6% |
| Pueblo | 0.0 /100 | #340 | Tragic 17.0% |
| Lumbee | 0.0 /100 | #341 | Tragic 17.0% |
| Immigrants | Yemen | 0.0 /100 | #342 | Tragic 17.5% |
| Pima | 0.0 /100 | #343 | Tragic 18.4% |
| Yup'ik | 0.0 /100 | #344 | Tragic 18.7% |
| Navajo | 0.0 /100 | #345 | Tragic 18.8% |
Demographics Similar to Yugoslavians by Family Poverty
In terms of family poverty, the demographic groups most similar to Yugoslavians are Immigrants from Germany (8.5%, a difference of 0.030%), Albanian (8.5%, a difference of 0.050%), Immigrants from South Eastern Asia (8.5%, a difference of 0.070%), Immigrants from Belarus (8.5%, a difference of 0.080%), and Immigrants from Ukraine (8.5%, a difference of 0.11%).
| Demographics | Rating | Rank | Family Poverty |
| Immigrants | Malaysia | 86.5 /100 | #135 | Excellent 8.5% |
| Immigrants | Brazil | 86.3 /100 | #136 | Excellent 8.5% |
| Immigrants | Southern Europe | 86.0 /100 | #137 | Excellent 8.5% |
| Armenians | 84.6 /100 | #138 | Excellent 8.5% |
| Immigrants | Nepal | 84.2 /100 | #139 | Excellent 8.5% |
| Immigrants | Kazakhstan | 84.1 /100 | #140 | Excellent 8.5% |
| Immigrants | Ukraine | 83.9 /100 | #141 | Excellent 8.5% |
| Yugoslavians | 83.5 /100 | #142 | Excellent 8.5% |
| Immigrants | Germany | 83.3 /100 | #143 | Excellent 8.5% |
| Albanians | 83.3 /100 | #144 | Excellent 8.5% |
| Immigrants | South Eastern Asia | 83.2 /100 | #145 | Excellent 8.5% |
| Immigrants | Belarus | 83.2 /100 | #146 | Excellent 8.5% |
| Immigrants | Jordan | 83.0 /100 | #147 | Excellent 8.5% |
| Scotch-Irish | 82.2 /100 | #148 | Excellent 8.6% |
| Mongolians | 80.4 /100 | #149 | Excellent 8.6% |