Maltese vs Immigrants from Congo Receiving Food Stamps
COMPARE
Maltese
Immigrants from Congo
Receiving Food Stamps
Receiving Food Stamps Comparison
Maltese
Immigrants from Congo
8.9%
RECEIVING FOOD STAMPS
99.9/ 100
METRIC RATING
14th/ 347
METRIC RANK
14.1%
RECEIVING FOOD STAMPS
0.3/ 100
METRIC RATING
261st/ 347
METRIC RANK
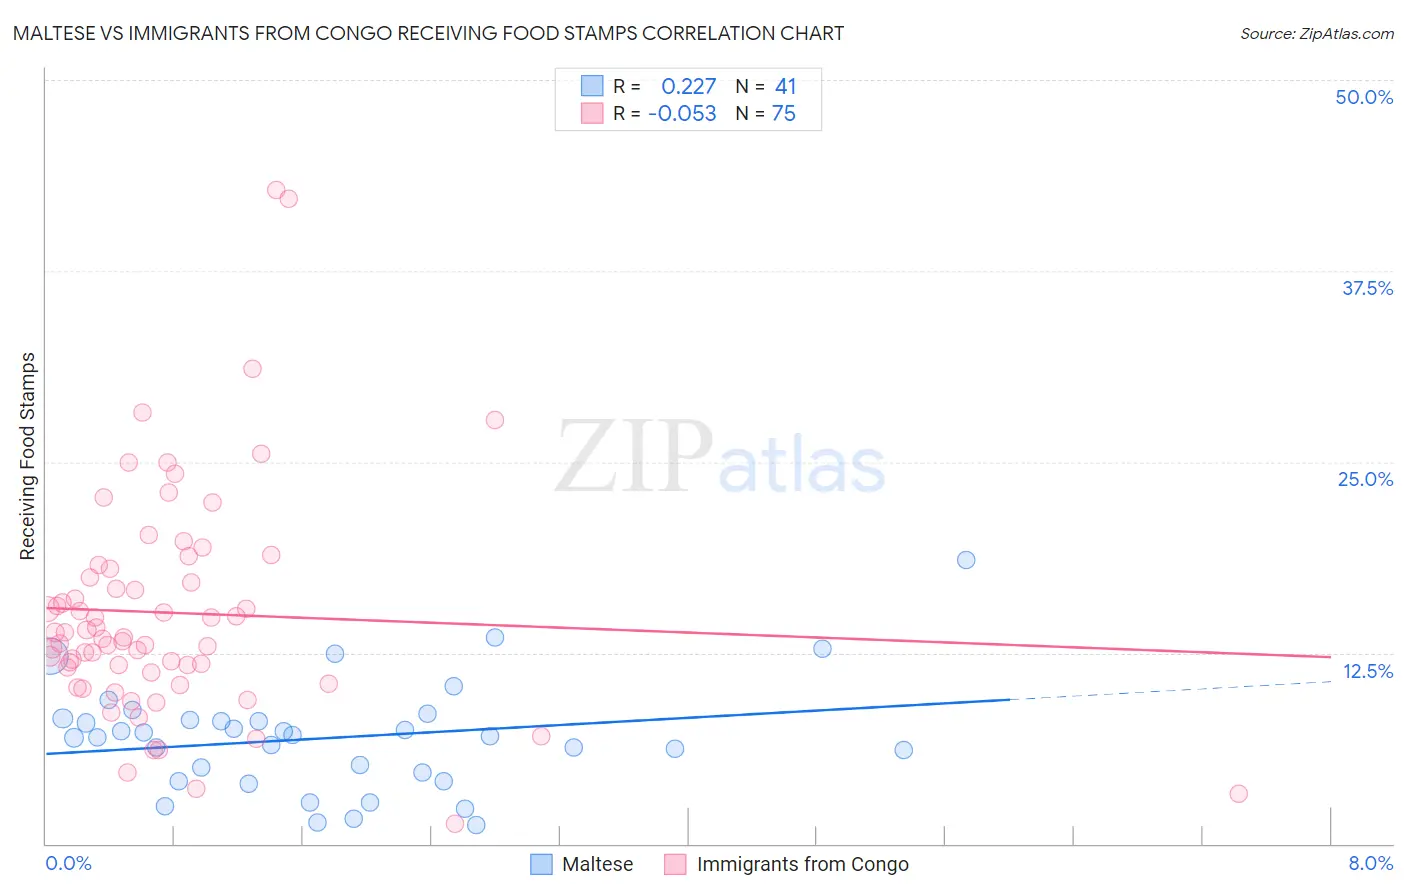
Maltese vs Immigrants from Congo Receiving Food Stamps Correlation Chart
The statistical analysis conducted on geographies consisting of 126,326,632 people shows a weak positive correlation between the proportion of Maltese and percentage of population receiving government assistance and/or food stamps in the United States with a correlation coefficient (R) of 0.227 and weighted average of 8.9%. Similarly, the statistical analysis conducted on geographies consisting of 92,058,964 people shows a slight negative correlation between the proportion of Immigrants from Congo and percentage of population receiving government assistance and/or food stamps in the United States with a correlation coefficient (R) of -0.053 and weighted average of 14.1%, a difference of 59.0%.
Receiving Food Stamps Correlation Summary
| Measurement | Maltese | Immigrants from Congo |
| Minimum | 1.2% | 1.3% |
| Maximum | 18.6% | 42.8% |
| Range | 17.4% | 41.5% |
| Mean | 6.9% | 15.1% |
| Median | 7.0% | 13.5% |
| Interquartile 25% (IQ1) | 4.4% | 11.2% |
| Interquartile 75% (IQ3) | 8.2% | 18.0% |
| Interquartile Range (IQR) | 3.8% | 6.8% |
| Standard Deviation (Sample) | 3.6% | 7.4% |
| Standard Deviation (Population) | 3.5% | 7.4% |
Similar Demographics by Receiving Food Stamps
Demographics Similar to Maltese by Receiving Food Stamps
In terms of receiving food stamps, the demographic groups most similar to Maltese are Bulgarian (8.9%, a difference of 0.13%), Okinawan (8.9%, a difference of 0.33%), Cypriot (8.9%, a difference of 0.33%), Norwegian (9.0%, a difference of 0.66%), and Immigrants from South Central Asia (8.8%, a difference of 0.77%).
| Demographics | Rating | Rank | Receiving Food Stamps |
| Immigrants | Iran | 100.0 /100 | #7 | Exceptional 8.3% |
| Burmese | 99.9 /100 | #8 | Exceptional 8.6% |
| Immigrants | Korea | 99.9 /100 | #9 | Exceptional 8.7% |
| Immigrants | South Central Asia | 99.9 /100 | #10 | Exceptional 8.8% |
| Okinawans | 99.9 /100 | #11 | Exceptional 8.9% |
| Cypriots | 99.9 /100 | #12 | Exceptional 8.9% |
| Bulgarians | 99.9 /100 | #13 | Exceptional 8.9% |
| Maltese | 99.9 /100 | #14 | Exceptional 8.9% |
| Norwegians | 99.9 /100 | #15 | Exceptional 9.0% |
| Immigrants | Japan | 99.9 /100 | #16 | Exceptional 9.0% |
| Immigrants | Scotland | 99.9 /100 | #17 | Exceptional 9.0% |
| Danes | 99.9 /100 | #18 | Exceptional 9.0% |
| Immigrants | Hong Kong | 99.8 /100 | #19 | Exceptional 9.1% |
| Latvians | 99.8 /100 | #20 | Exceptional 9.1% |
| Luxembourgers | 99.8 /100 | #21 | Exceptional 9.1% |
Demographics Similar to Immigrants from Congo by Receiving Food Stamps
In terms of receiving food stamps, the demographic groups most similar to Immigrants from Congo are Central American (14.1%, a difference of 0.010%), Creek (14.1%, a difference of 0.11%), Immigrants from Ghana (14.1%, a difference of 0.23%), Arapaho (14.1%, a difference of 0.31%), and Japanese (14.1%, a difference of 0.41%).
| Demographics | Rating | Rank | Receiving Food Stamps |
| Marshallese | 0.3 /100 | #254 | Tragic 14.1% |
| Sub-Saharan Africans | 0.3 /100 | #255 | Tragic 14.1% |
| Japanese | 0.3 /100 | #256 | Tragic 14.1% |
| Arapaho | 0.3 /100 | #257 | Tragic 14.1% |
| Immigrants | Ghana | 0.3 /100 | #258 | Tragic 14.1% |
| Creek | 0.3 /100 | #259 | Tragic 14.1% |
| Central Americans | 0.3 /100 | #260 | Tragic 14.1% |
| Immigrants | Congo | 0.3 /100 | #261 | Tragic 14.1% |
| Paiute | 0.2 /100 | #262 | Tragic 14.3% |
| Immigrants | Portugal | 0.2 /100 | #263 | Tragic 14.3% |
| Immigrants | Uzbekistan | 0.2 /100 | #264 | Tragic 14.3% |
| Blackfeet | 0.2 /100 | #265 | Tragic 14.3% |
| Cheyenne | 0.2 /100 | #266 | Tragic 14.3% |
| Dutch West Indians | 0.2 /100 | #267 | Tragic 14.3% |
| Guatemalans | 0.1 /100 | #268 | Tragic 14.4% |