Malaysian vs Osage Female Poverty
COMPARE
Malaysian
Osage
Female Poverty
Female Poverty Comparison
Malaysians
Osage
14.3%
FEMALE POVERTY
7.4/ 100
METRIC RATING
210th/ 347
METRIC RANK
14.8%
FEMALE POVERTY
1.5/ 100
METRIC RATING
232nd/ 347
METRIC RANK
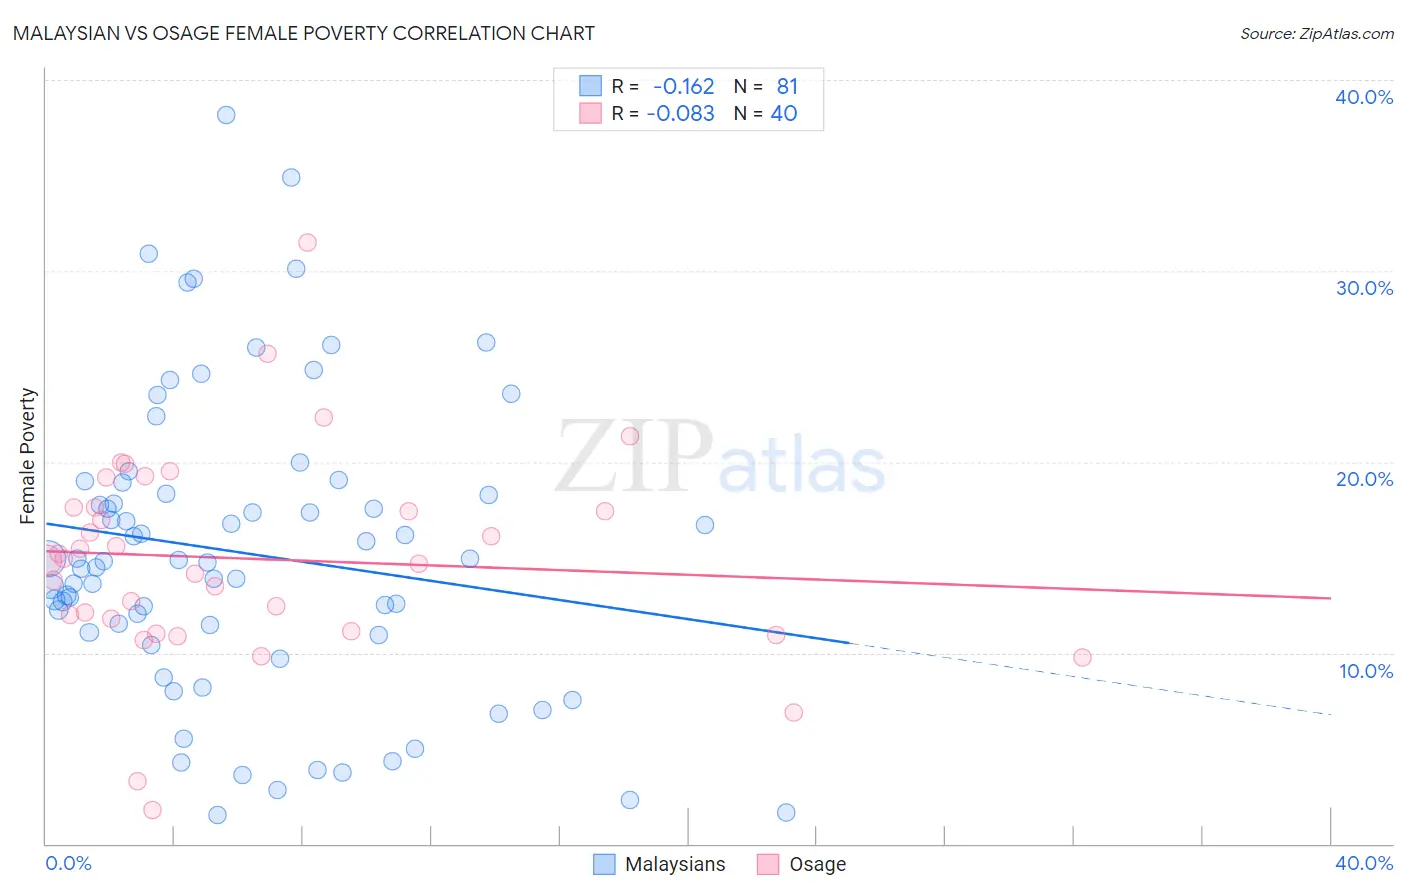
Malaysian vs Osage Female Poverty Correlation Chart
The statistical analysis conducted on geographies consisting of 225,983,571 people shows a poor negative correlation between the proportion of Malaysians and poverty level among females in the United States with a correlation coefficient (R) of -0.162 and weighted average of 14.3%. Similarly, the statistical analysis conducted on geographies consisting of 91,795,919 people shows a slight negative correlation between the proportion of Osage and poverty level among females in the United States with a correlation coefficient (R) of -0.083 and weighted average of 14.8%, a difference of 3.8%.
Female Poverty Correlation Summary
| Measurement | Malaysian | Osage |
| Minimum | 1.5% | 1.8% |
| Maximum | 38.2% | 31.5% |
| Range | 36.7% | 29.7% |
| Mean | 15.2% | 14.9% |
| Median | 14.8% | 14.9% |
| Interquartile 25% (IQ1) | 11.0% | 11.4% |
| Interquartile 75% (IQ3) | 18.7% | 17.6% |
| Interquartile Range (IQR) | 7.6% | 6.2% |
| Standard Deviation (Sample) | 7.8% | 5.5% |
| Standard Deviation (Population) | 7.7% | 5.4% |
Similar Demographics by Female Poverty
Demographics Similar to Malaysians by Female Poverty
In terms of female poverty, the demographic groups most similar to Malaysians are Panamanian (14.2%, a difference of 0.080%), Moroccan (14.3%, a difference of 0.080%), Immigrants from the Azores (14.2%, a difference of 0.15%), Immigrants from Eastern Africa (14.2%, a difference of 0.49%), and Bermudan (14.4%, a difference of 0.72%).
| Demographics | Rating | Rank | Female Poverty |
| Immigrants | Western Asia | 20.7 /100 | #203 | Fair 13.9% |
| Spaniards | 18.9 /100 | #204 | Poor 13.9% |
| Ugandans | 15.4 /100 | #205 | Poor 14.0% |
| Immigrants | Uruguay | 14.0 /100 | #206 | Poor 14.0% |
| Immigrants | Eastern Africa | 9.0 /100 | #207 | Tragic 14.2% |
| Immigrants | Azores | 7.9 /100 | #208 | Tragic 14.2% |
| Panamanians | 7.7 /100 | #209 | Tragic 14.2% |
| Malaysians | 7.4 /100 | #210 | Tragic 14.3% |
| Moroccans | 7.2 /100 | #211 | Tragic 14.3% |
| Bermudans | 5.5 /100 | #212 | Tragic 14.4% |
| Alaskan Athabascans | 5.3 /100 | #213 | Tragic 14.4% |
| Marshallese | 5.0 /100 | #214 | Tragic 14.4% |
| Immigrants | Panama | 4.7 /100 | #215 | Tragic 14.4% |
| Immigrants | Thailand | 4.5 /100 | #216 | Tragic 14.4% |
| Immigrants | Immigrants | 4.5 /100 | #217 | Tragic 14.4% |
Demographics Similar to Osage by Female Poverty
In terms of female poverty, the demographic groups most similar to Osage are Immigrants from Saudi Arabia (14.8%, a difference of 0.10%), Nigerian (14.8%, a difference of 0.31%), Alaska Native (14.7%, a difference of 0.41%), Ghanaian (14.7%, a difference of 0.61%), and Fijian (14.9%, a difference of 0.62%).
| Demographics | Rating | Rank | Female Poverty |
| Immigrants | Micronesia | 2.8 /100 | #225 | Tragic 14.6% |
| Immigrants | Eritrea | 2.4 /100 | #226 | Tragic 14.6% |
| Immigrants | Nigeria | 2.1 /100 | #227 | Tragic 14.7% |
| German Russians | 2.0 /100 | #228 | Tragic 14.7% |
| Ghanaians | 1.9 /100 | #229 | Tragic 14.7% |
| Alaska Natives | 1.8 /100 | #230 | Tragic 14.7% |
| Nigerians | 1.7 /100 | #231 | Tragic 14.8% |
| Osage | 1.5 /100 | #232 | Tragic 14.8% |
| Immigrants | Saudi Arabia | 1.4 /100 | #233 | Tragic 14.8% |
| Fijians | 1.1 /100 | #234 | Tragic 14.9% |
| Immigrants | Laos | 0.9 /100 | #235 | Tragic 15.0% |
| Cree | 0.7 /100 | #236 | Tragic 15.1% |
| French American Indians | 0.6 /100 | #237 | Tragic 15.1% |
| Immigrants | Armenia | 0.6 /100 | #238 | Tragic 15.1% |
| Immigrants | Middle Africa | 0.5 /100 | #239 | Tragic 15.2% |