Malaysian vs Central American Receiving Food Stamps
COMPARE
Malaysian
Central American
Receiving Food Stamps
Receiving Food Stamps Comparison
Malaysians
Central Americans
12.7%
RECEIVING FOOD STAMPS
8.5/ 100
METRIC RATING
212th/ 347
METRIC RANK
14.1%
RECEIVING FOOD STAMPS
0.3/ 100
METRIC RATING
260th/ 347
METRIC RANK
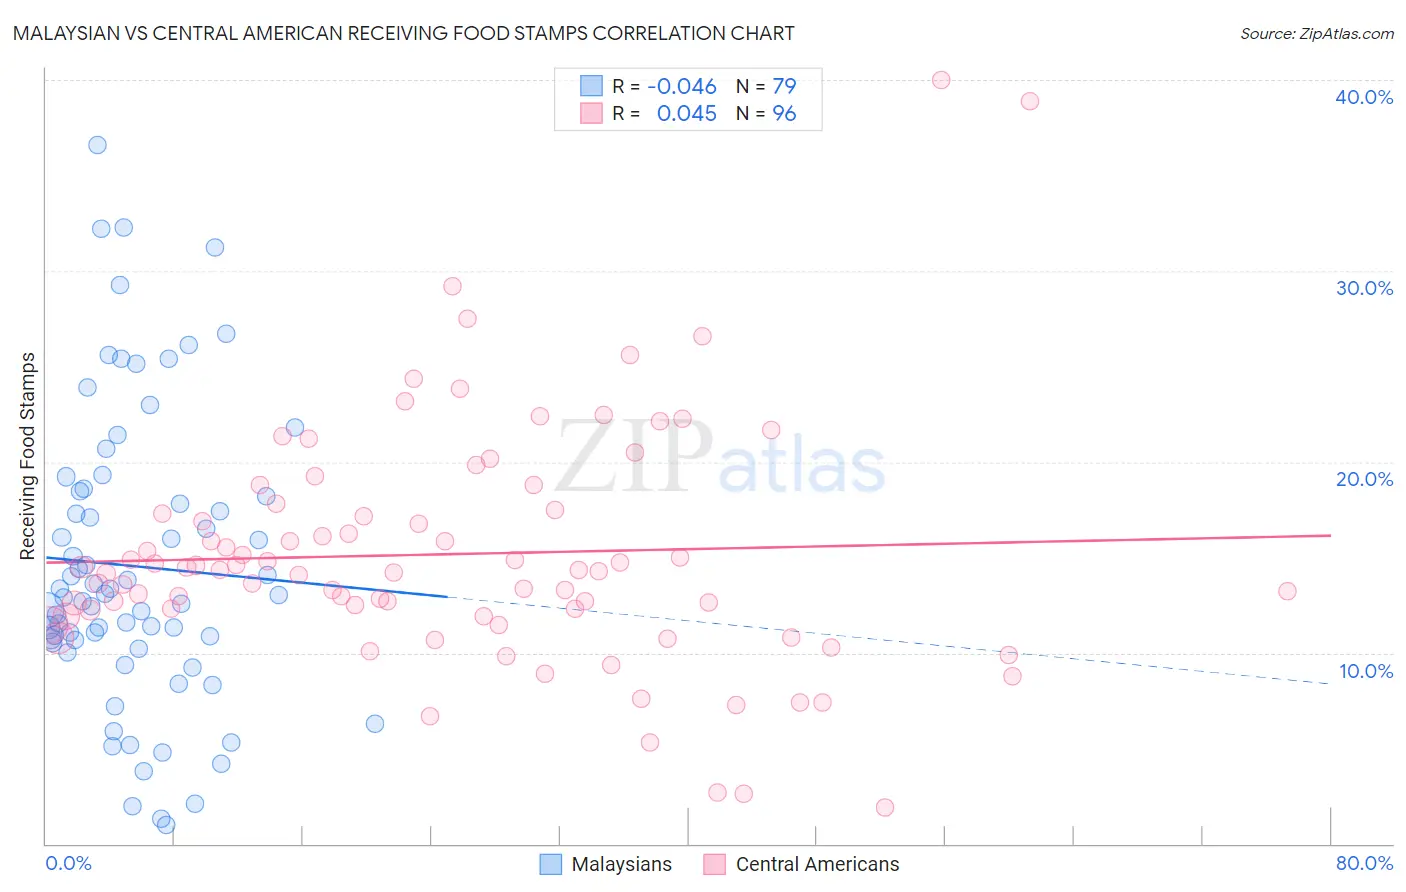
Malaysian vs Central American Receiving Food Stamps Correlation Chart
The statistical analysis conducted on geographies consisting of 225,895,632 people shows no correlation between the proportion of Malaysians and percentage of population receiving government assistance and/or food stamps in the United States with a correlation coefficient (R) of -0.046 and weighted average of 12.7%. Similarly, the statistical analysis conducted on geographies consisting of 502,597,992 people shows no correlation between the proportion of Central Americans and percentage of population receiving government assistance and/or food stamps in the United States with a correlation coefficient (R) of 0.045 and weighted average of 14.1%, a difference of 11.3%.
Receiving Food Stamps Correlation Summary
| Measurement | Malaysian | Central American |
| Minimum | 1.0% | 1.9% |
| Maximum | 36.6% | 40.0% |
| Range | 35.6% | 38.1% |
| Mean | 14.5% | 15.2% |
| Median | 13.0% | 14.3% |
| Interquartile 25% (IQ1) | 10.5% | 12.1% |
| Interquartile 75% (IQ3) | 18.5% | 17.4% |
| Interquartile Range (IQR) | 8.0% | 5.3% |
| Standard Deviation (Sample) | 7.7% | 6.3% |
| Standard Deviation (Population) | 7.6% | 6.3% |
Similar Demographics by Receiving Food Stamps
Demographics Similar to Malaysians by Receiving Food Stamps
In terms of receiving food stamps, the demographic groups most similar to Malaysians are Moroccan (12.8%, a difference of 0.40%), Immigrants from Africa (12.8%, a difference of 0.43%), Colombian (12.6%, a difference of 0.63%), Native Hawaiian (12.8%, a difference of 0.87%), and Immigrants from South America (12.8%, a difference of 0.98%).
| Demographics | Rating | Rank | Receiving Food Stamps |
| Aleuts | 17.3 /100 | #205 | Poor 12.4% |
| Immigrants | Thailand | 17.0 /100 | #206 | Poor 12.4% |
| South Americans | 16.0 /100 | #207 | Poor 12.4% |
| Potawatomi | 14.6 /100 | #208 | Poor 12.5% |
| Immigrants | Sierra Leone | 12.9 /100 | #209 | Poor 12.5% |
| Immigrants | Uruguay | 12.8 /100 | #210 | Poor 12.5% |
| Colombians | 10.2 /100 | #211 | Poor 12.6% |
| Malaysians | 8.5 /100 | #212 | Tragic 12.7% |
| Moroccans | 7.6 /100 | #213 | Tragic 12.8% |
| Immigrants | Africa | 7.6 /100 | #214 | Tragic 12.8% |
| Native Hawaiians | 6.7 /100 | #215 | Tragic 12.8% |
| Immigrants | South America | 6.5 /100 | #216 | Tragic 12.8% |
| Immigrants | Burma/Myanmar | 6.0 /100 | #217 | Tragic 12.9% |
| Hawaiians | 5.4 /100 | #218 | Tragic 12.9% |
| Immigrants | Middle Africa | 5.4 /100 | #219 | Tragic 12.9% |
Demographics Similar to Central Americans by Receiving Food Stamps
In terms of receiving food stamps, the demographic groups most similar to Central Americans are Immigrants from Congo (14.1%, a difference of 0.010%), Creek (14.1%, a difference of 0.090%), Immigrants from Ghana (14.1%, a difference of 0.22%), Arapaho (14.1%, a difference of 0.30%), and Japanese (14.1%, a difference of 0.40%).
| Demographics | Rating | Rank | Receiving Food Stamps |
| Spanish Americans | 0.4 /100 | #253 | Tragic 14.0% |
| Marshallese | 0.3 /100 | #254 | Tragic 14.1% |
| Sub-Saharan Africans | 0.3 /100 | #255 | Tragic 14.1% |
| Japanese | 0.3 /100 | #256 | Tragic 14.1% |
| Arapaho | 0.3 /100 | #257 | Tragic 14.1% |
| Immigrants | Ghana | 0.3 /100 | #258 | Tragic 14.1% |
| Creek | 0.3 /100 | #259 | Tragic 14.1% |
| Central Americans | 0.3 /100 | #260 | Tragic 14.1% |
| Immigrants | Congo | 0.3 /100 | #261 | Tragic 14.1% |
| Paiute | 0.2 /100 | #262 | Tragic 14.3% |
| Immigrants | Portugal | 0.2 /100 | #263 | Tragic 14.3% |
| Immigrants | Uzbekistan | 0.2 /100 | #264 | Tragic 14.3% |
| Blackfeet | 0.2 /100 | #265 | Tragic 14.3% |
| Cheyenne | 0.2 /100 | #266 | Tragic 14.3% |
| Dutch West Indians | 0.2 /100 | #267 | Tragic 14.3% |