Luxembourger vs Polish Seniors Poverty Over the Age of 65
COMPARE
Luxembourger
Polish
Seniors Poverty Over the Age of 65
Seniors Poverty Over the Age of 65 Comparison
Luxembourgers
Poles
9.2%
SENIORS POVERTY OVER THE AGE OF 65
99.9/ 100
METRIC RATING
21st/ 347
METRIC RANK
9.1%
SENIORS POVERTY OVER THE AGE OF 65
99.9/ 100
METRIC RATING
14th/ 347
METRIC RANK
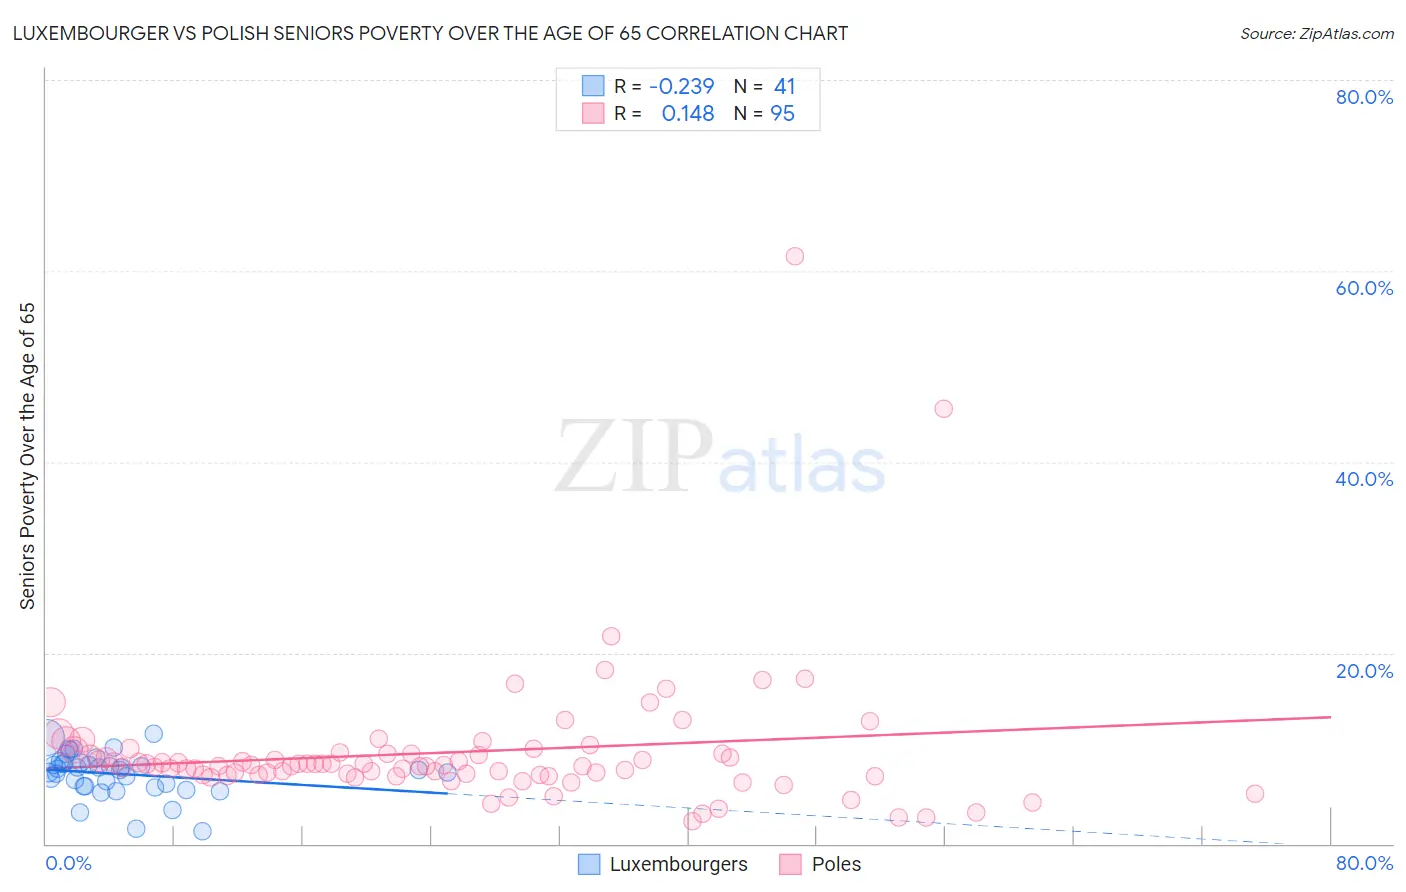
Luxembourger vs Polish Seniors Poverty Over the Age of 65 Correlation Chart
The statistical analysis conducted on geographies consisting of 144,471,416 people shows a weak negative correlation between the proportion of Luxembourgers and poverty level among seniors over the age of 65 in the United States with a correlation coefficient (R) of -0.239 and weighted average of 9.2%. Similarly, the statistical analysis conducted on geographies consisting of 555,313,476 people shows a poor positive correlation between the proportion of Poles and poverty level among seniors over the age of 65 in the United States with a correlation coefficient (R) of 0.148 and weighted average of 9.1%, a difference of 1.3%.
Seniors Poverty Over the Age of 65 Correlation Summary
| Measurement | Luxembourger | Polish |
| Minimum | 1.3% | 2.4% |
| Maximum | 11.5% | 61.5% |
| Range | 10.2% | 59.2% |
| Mean | 7.3% | 9.6% |
| Median | 7.7% | 8.3% |
| Interquartile 25% (IQ1) | 6.0% | 7.2% |
| Interquartile 75% (IQ3) | 8.5% | 9.5% |
| Interquartile Range (IQR) | 2.5% | 2.3% |
| Standard Deviation (Sample) | 2.2% | 7.4% |
| Standard Deviation (Population) | 2.2% | 7.3% |
Demographics Similar to Luxembourgers and Poles by Seniors Poverty Over the Age of 65
In terms of seniors poverty over the age of 65, the demographic groups most similar to Luxembourgers are Slovene (9.3%, a difference of 0.030%), Welsh (9.3%, a difference of 0.080%), Bulgarian (9.3%, a difference of 0.16%), Thai (9.2%, a difference of 0.29%), and Swiss (9.2%, a difference of 0.43%). Similarly, the demographic groups most similar to Poles are Croatian (9.1%, a difference of 0.030%), Dutch (9.1%, a difference of 0.070%), Scandinavian (9.1%, a difference of 0.080%), Maltese (9.1%, a difference of 0.26%), and European (9.2%, a difference of 0.43%).
| Demographics | Rating | Rank | Seniors Poverty Over the Age of 65 |
| Germans | 100.0 /100 | #7 | Exceptional 9.0% |
| Czechs | 100.0 /100 | #8 | Exceptional 9.0% |
| English | 100.0 /100 | #9 | Exceptional 9.1% |
| Lithuanians | 100.0 /100 | #10 | Exceptional 9.1% |
| Maltese | 99.9 /100 | #11 | Exceptional 9.1% |
| Scandinavians | 99.9 /100 | #12 | Exceptional 9.1% |
| Croatians | 99.9 /100 | #13 | Exceptional 9.1% |
| Poles | 99.9 /100 | #14 | Exceptional 9.1% |
| Dutch | 99.9 /100 | #15 | Exceptional 9.1% |
| Europeans | 99.9 /100 | #16 | Exceptional 9.2% |
| Scottish | 99.9 /100 | #17 | Exceptional 9.2% |
| Slovaks | 99.9 /100 | #18 | Exceptional 9.2% |
| Swiss | 99.9 /100 | #19 | Exceptional 9.2% |
| Thais | 99.9 /100 | #20 | Exceptional 9.2% |
| Luxembourgers | 99.9 /100 | #21 | Exceptional 9.2% |
| Slovenes | 99.9 /100 | #22 | Exceptional 9.3% |
| Welsh | 99.9 /100 | #23 | Exceptional 9.3% |
| Bulgarians | 99.9 /100 | #24 | Exceptional 9.3% |
| Irish | 99.9 /100 | #25 | Exceptional 9.3% |
| Immigrants | Scotland | 99.9 /100 | #26 | Exceptional 9.3% |
| Italians | 99.9 /100 | #27 | Exceptional 9.3% |