Luxembourger vs Iraqi Seniors Poverty Over the Age of 65
COMPARE
Luxembourger
Iraqi
Seniors Poverty Over the Age of 65
Seniors Poverty Over the Age of 65 Comparison
Luxembourgers
Iraqis
9.2%
SENIORS POVERTY OVER THE AGE OF 65
99.9/ 100
METRIC RATING
21st/ 347
METRIC RANK
10.6%
SENIORS POVERTY OVER THE AGE OF 65
80.7/ 100
METRIC RATING
144th/ 347
METRIC RANK
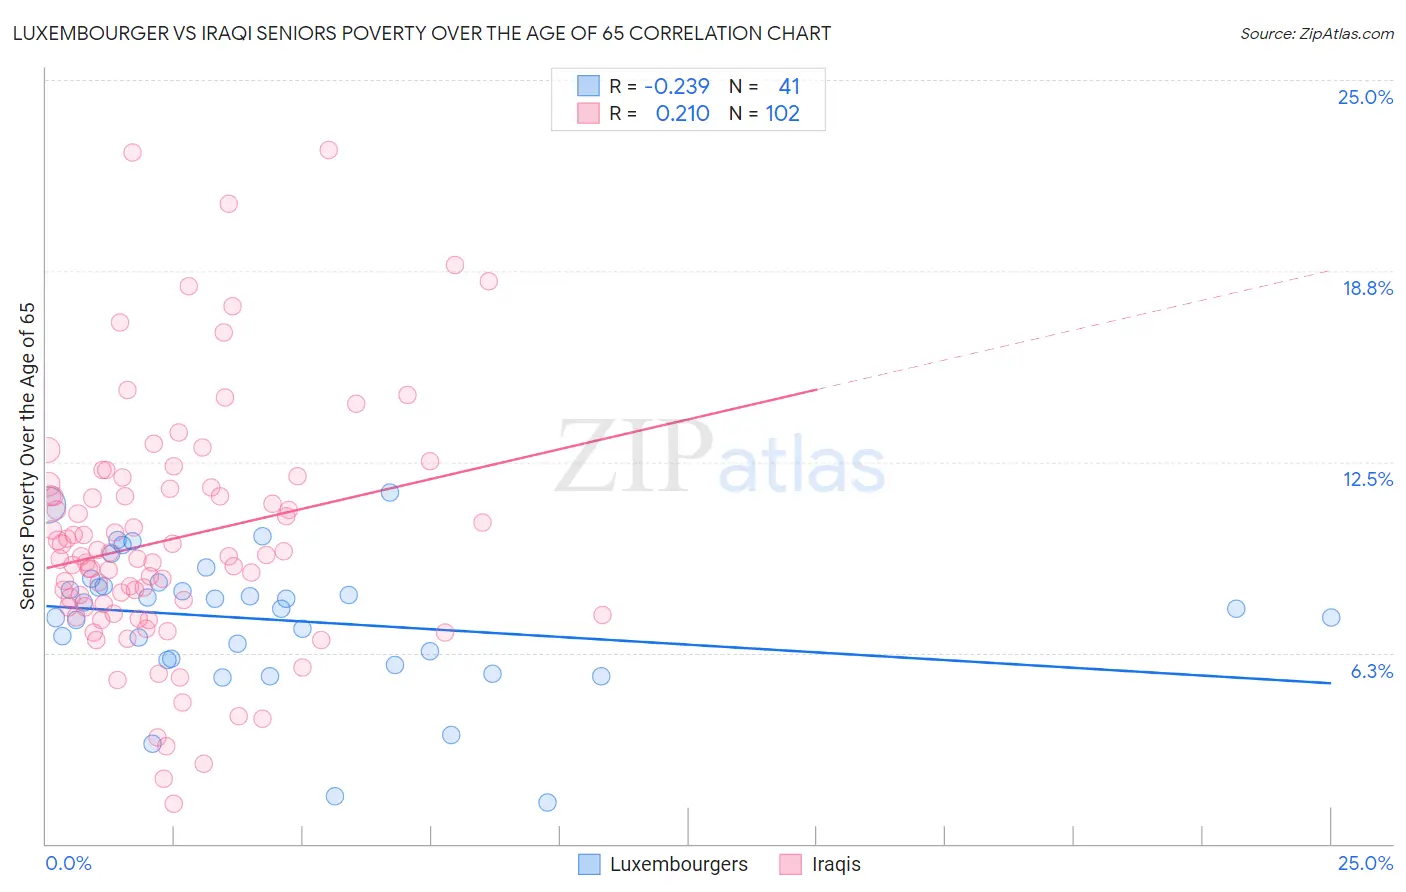
Luxembourger vs Iraqi Seniors Poverty Over the Age of 65 Correlation Chart
The statistical analysis conducted on geographies consisting of 144,471,416 people shows a weak negative correlation between the proportion of Luxembourgers and poverty level among seniors over the age of 65 in the United States with a correlation coefficient (R) of -0.239 and weighted average of 9.2%. Similarly, the statistical analysis conducted on geographies consisting of 170,503,666 people shows a weak positive correlation between the proportion of Iraqis and poverty level among seniors over the age of 65 in the United States with a correlation coefficient (R) of 0.210 and weighted average of 10.6%, a difference of 14.5%.
Seniors Poverty Over the Age of 65 Correlation Summary
| Measurement | Luxembourger | Iraqi |
| Minimum | 1.3% | 1.3% |
| Maximum | 11.5% | 22.7% |
| Range | 10.2% | 21.4% |
| Mean | 7.3% | 10.0% |
| Median | 7.7% | 9.4% |
| Interquartile 25% (IQ1) | 6.0% | 7.8% |
| Interquartile 75% (IQ3) | 8.5% | 11.6% |
| Interquartile Range (IQR) | 2.5% | 3.9% |
| Standard Deviation (Sample) | 2.2% | 4.0% |
| Standard Deviation (Population) | 2.2% | 4.0% |
Similar Demographics by Seniors Poverty Over the Age of 65
Demographics Similar to Luxembourgers by Seniors Poverty Over the Age of 65
In terms of seniors poverty over the age of 65, the demographic groups most similar to Luxembourgers are Slovene (9.3%, a difference of 0.030%), Welsh (9.3%, a difference of 0.080%), Bulgarian (9.3%, a difference of 0.16%), Thai (9.2%, a difference of 0.29%), and Swiss (9.2%, a difference of 0.43%).
| Demographics | Rating | Rank | Seniors Poverty Over the Age of 65 |
| Poles | 99.9 /100 | #14 | Exceptional 9.1% |
| Dutch | 99.9 /100 | #15 | Exceptional 9.1% |
| Europeans | 99.9 /100 | #16 | Exceptional 9.2% |
| Scottish | 99.9 /100 | #17 | Exceptional 9.2% |
| Slovaks | 99.9 /100 | #18 | Exceptional 9.2% |
| Swiss | 99.9 /100 | #19 | Exceptional 9.2% |
| Thais | 99.9 /100 | #20 | Exceptional 9.2% |
| Luxembourgers | 99.9 /100 | #21 | Exceptional 9.2% |
| Slovenes | 99.9 /100 | #22 | Exceptional 9.3% |
| Welsh | 99.9 /100 | #23 | Exceptional 9.3% |
| Bulgarians | 99.9 /100 | #24 | Exceptional 9.3% |
| Irish | 99.9 /100 | #25 | Exceptional 9.3% |
| Immigrants | Scotland | 99.9 /100 | #26 | Exceptional 9.3% |
| Italians | 99.9 /100 | #27 | Exceptional 9.3% |
| Tongans | 99.9 /100 | #28 | Exceptional 9.3% |
Demographics Similar to Iraqis by Seniors Poverty Over the Age of 65
In terms of seniors poverty over the age of 65, the demographic groups most similar to Iraqis are Immigrants from Asia (10.6%, a difference of 0.020%), Laotian (10.6%, a difference of 0.12%), Alaskan Athabascan (10.6%, a difference of 0.22%), Immigrants from Greece (10.6%, a difference of 0.24%), and Osage (10.6%, a difference of 0.33%).
| Demographics | Rating | Rank | Seniors Poverty Over the Age of 65 |
| Immigrants | Australia | 85.1 /100 | #137 | Excellent 10.5% |
| Immigrants | Latvia | 84.7 /100 | #138 | Excellent 10.5% |
| Portuguese | 84.1 /100 | #139 | Excellent 10.5% |
| Immigrants | Kenya | 83.4 /100 | #140 | Excellent 10.5% |
| Immigrants | Europe | 83.3 /100 | #141 | Excellent 10.5% |
| Osage | 82.8 /100 | #142 | Excellent 10.6% |
| Immigrants | Asia | 80.8 /100 | #143 | Excellent 10.6% |
| Iraqis | 80.7 /100 | #144 | Excellent 10.6% |
| Laotians | 79.9 /100 | #145 | Good 10.6% |
| Alaskan Athabascans | 79.1 /100 | #146 | Good 10.6% |
| Immigrants | Greece | 79.0 /100 | #147 | Good 10.6% |
| Americans | 78.1 /100 | #148 | Good 10.6% |
| Immigrants | Cameroon | 78.1 /100 | #149 | Good 10.6% |
| Immigrants | Switzerland | 77.3 /100 | #150 | Good 10.6% |
| Spanish | 76.8 /100 | #151 | Good 10.6% |