Lumbee vs Tongan Single Female Poverty
COMPARE
Lumbee
Tongan
Single Female Poverty
Single Female Poverty Comparison
Lumbee
Tongans
33.0%
SINGLE FEMALE POVERTY
0.0/ 100
METRIC RATING
344th/ 347
METRIC RANK
18.8%
SINGLE FEMALE POVERTY
99.9/ 100
METRIC RATING
38th/ 347
METRIC RANK
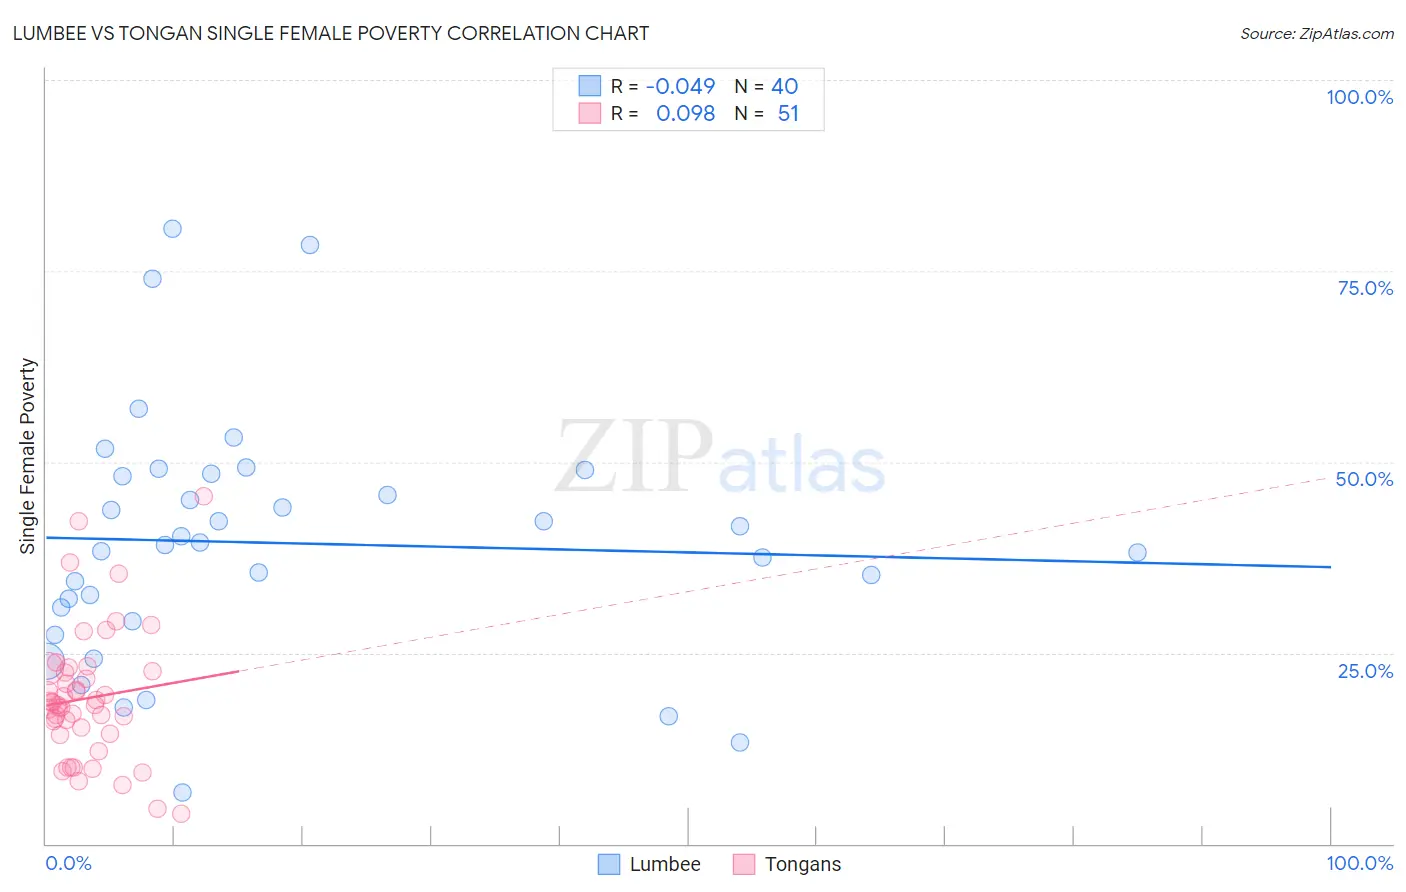
Lumbee vs Tongan Single Female Poverty Correlation Chart
The statistical analysis conducted on geographies consisting of 91,816,335 people shows no correlation between the proportion of Lumbee and poverty level among single females in the United States with a correlation coefficient (R) of -0.049 and weighted average of 33.0%. Similarly, the statistical analysis conducted on geographies consisting of 102,377,778 people shows a slight positive correlation between the proportion of Tongans and poverty level among single females in the United States with a correlation coefficient (R) of 0.098 and weighted average of 18.8%, a difference of 75.7%.
Single Female Poverty Correlation Summary
| Measurement | Lumbee | Tongan |
| Minimum | 6.8% | 4.0% |
| Maximum | 80.6% | 45.5% |
| Range | 73.8% | 41.5% |
| Mean | 39.4% | 19.1% |
| Median | 39.3% | 18.2% |
| Interquartile 25% (IQ1) | 30.1% | 14.3% |
| Interquartile 75% (IQ3) | 48.3% | 22.6% |
| Interquartile Range (IQR) | 18.2% | 8.2% |
| Standard Deviation (Sample) | 16.1% | 8.5% |
| Standard Deviation (Population) | 15.9% | 8.4% |
Similar Demographics by Single Female Poverty
Demographics Similar to Lumbee by Single Female Poverty
In terms of single female poverty, the demographic groups most similar to Lumbee are Crow (32.4%, a difference of 1.8%), Houma (33.8%, a difference of 2.4%), Puerto Rican (34.1%, a difference of 3.3%), Tohono O'odham (34.2%, a difference of 3.6%), and Navajo (31.7%, a difference of 4.3%).
| Demographics | Rating | Rank | Single Female Poverty |
| Ute | 0.0 /100 | #333 | Tragic 28.4% |
| Pueblo | 0.0 /100 | #334 | Tragic 28.6% |
| Immigrants | Yemen | 0.0 /100 | #335 | Tragic 28.9% |
| Colville | 0.0 /100 | #336 | Tragic 29.1% |
| Yuman | 0.0 /100 | #337 | Tragic 29.4% |
| Pima | 0.0 /100 | #338 | Tragic 30.3% |
| Cheyenne | 0.0 /100 | #339 | Tragic 30.4% |
| Cajuns | 0.0 /100 | #340 | Tragic 30.6% |
| Sioux | 0.0 /100 | #341 | Tragic 31.3% |
| Navajo | 0.0 /100 | #342 | Tragic 31.7% |
| Crow | 0.0 /100 | #343 | Tragic 32.4% |
| Lumbee | 0.0 /100 | #344 | Tragic 33.0% |
| Houma | 0.0 /100 | #345 | Tragic 33.8% |
| Puerto Ricans | 0.0 /100 | #346 | Tragic 34.1% |
| Tohono O'odham | 0.0 /100 | #347 | Tragic 34.2% |
Demographics Similar to Tongans by Single Female Poverty
In terms of single female poverty, the demographic groups most similar to Tongans are Bulgarian (18.8%, a difference of 0.030%), Okinawan (18.8%, a difference of 0.060%), Immigrants from Serbia (18.8%, a difference of 0.080%), Jordanian (18.8%, a difference of 0.16%), and Immigrants from Romania (18.8%, a difference of 0.31%).
| Demographics | Rating | Rank | Single Female Poverty |
| Immigrants | Asia | 99.9 /100 | #31 | Exceptional 18.6% |
| Immigrants | Sri Lanka | 99.9 /100 | #32 | Exceptional 18.6% |
| Immigrants | Philippines | 99.9 /100 | #33 | Exceptional 18.6% |
| Koreans | 99.9 /100 | #34 | Exceptional 18.6% |
| Immigrants | Japan | 99.9 /100 | #35 | Exceptional 18.6% |
| Turks | 99.9 /100 | #36 | Exceptional 18.7% |
| Immigrants | Armenia | 99.9 /100 | #37 | Exceptional 18.7% |
| Tongans | 99.9 /100 | #38 | Exceptional 18.8% |
| Bulgarians | 99.9 /100 | #39 | Exceptional 18.8% |
| Okinawans | 99.9 /100 | #40 | Exceptional 18.8% |
| Immigrants | Serbia | 99.9 /100 | #41 | Exceptional 18.8% |
| Jordanians | 99.9 /100 | #42 | Exceptional 18.8% |
| Immigrants | Romania | 99.9 /100 | #43 | Exceptional 18.8% |
| Immigrants | Croatia | 99.9 /100 | #44 | Exceptional 18.9% |
| Immigrants | Indonesia | 99.8 /100 | #45 | Exceptional 18.9% |