Lumbee vs Immigrants from Hong Kong Poverty
COMPARE
Lumbee
Immigrants from Hong Kong
Poverty
Poverty Comparison
Lumbee
Immigrants from Hong Kong
21.9%
POVERTY
0.0/ 100
METRIC RATING
344th/ 347
METRIC RANK
10.4%
POVERTY
99.8/ 100
METRIC RATING
13th/ 347
METRIC RANK
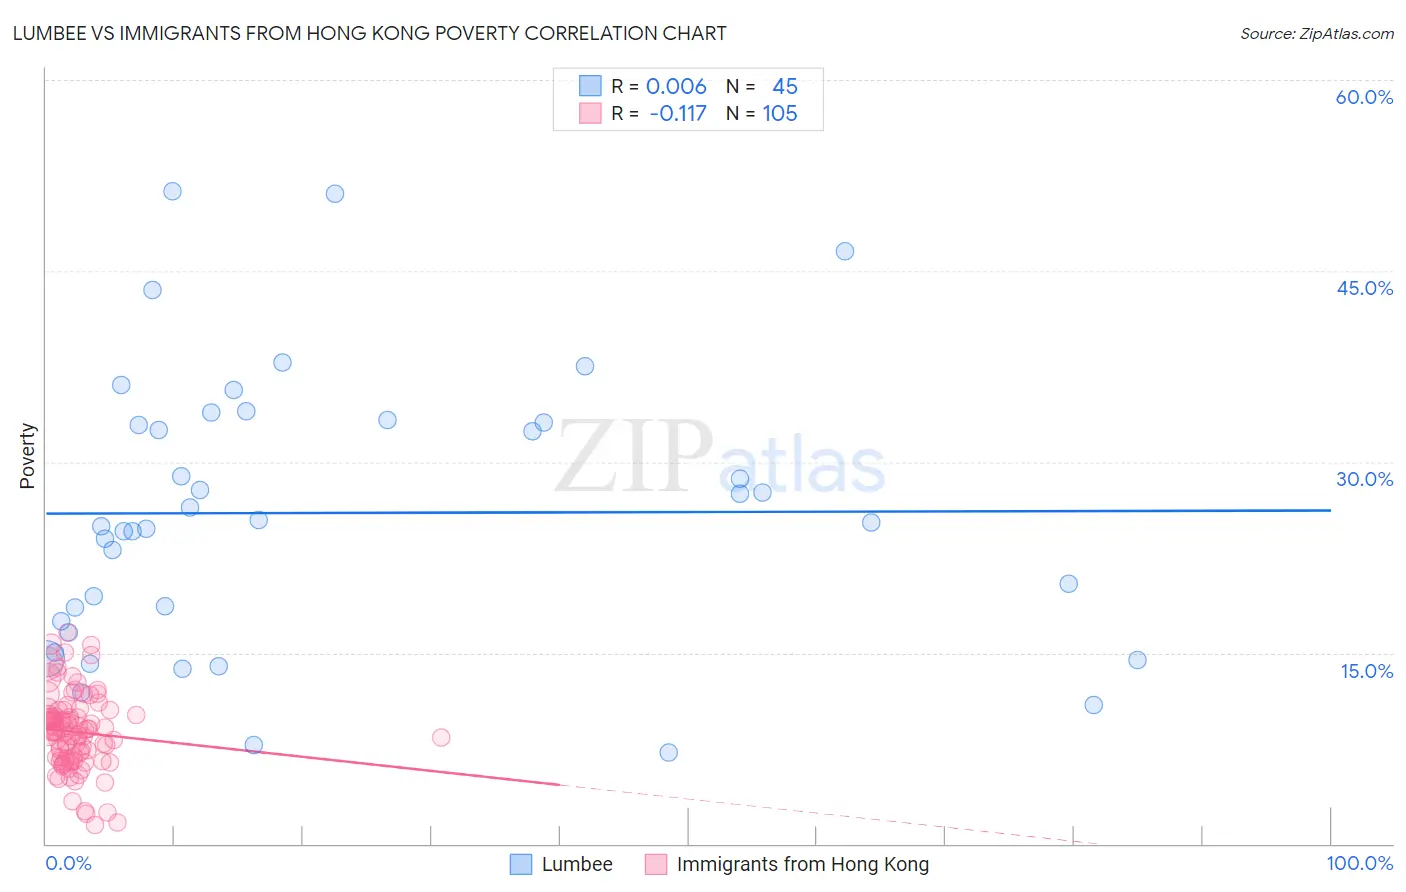
Lumbee vs Immigrants from Hong Kong Poverty Correlation Chart
The statistical analysis conducted on geographies consisting of 92,257,257 people shows no correlation between the proportion of Lumbee and poverty level in the United States with a correlation coefficient (R) of 0.006 and weighted average of 21.9%. Similarly, the statistical analysis conducted on geographies consisting of 253,892,762 people shows a poor negative correlation between the proportion of Immigrants from Hong Kong and poverty level in the United States with a correlation coefficient (R) of -0.117 and weighted average of 10.4%, a difference of 110.5%.
Poverty Correlation Summary
| Measurement | Lumbee | Immigrants from Hong Kong |
| Minimum | 7.2% | 1.5% |
| Maximum | 51.2% | 16.6% |
| Range | 44.0% | 15.1% |
| Mean | 26.0% | 8.8% |
| Median | 25.2% | 8.9% |
| Interquartile 25% (IQ1) | 17.0% | 6.7% |
| Interquartile 75% (IQ3) | 33.2% | 10.1% |
| Interquartile Range (IQR) | 16.2% | 3.4% |
| Standard Deviation (Sample) | 10.8% | 3.0% |
| Standard Deviation (Population) | 10.7% | 3.0% |
Similar Demographics by Poverty
Demographics Similar to Lumbee by Poverty
In terms of poverty, the demographic groups most similar to Lumbee are Pima (21.9%, a difference of 0.26%), Immigrants from Yemen (21.5%, a difference of 1.9%), Hopi (20.8%, a difference of 5.1%), Yup'ik (20.8%, a difference of 5.3%), and Navajo (23.1%, a difference of 5.4%).
| Demographics | Rating | Rank | Poverty |
| Houma | 0.0 /100 | #333 | Tragic 18.4% |
| Apache | 0.0 /100 | #334 | Tragic 18.4% |
| Cheyenne | 0.0 /100 | #335 | Tragic 18.9% |
| Pueblo | 0.0 /100 | #336 | Tragic 19.4% |
| Sioux | 0.0 /100 | #337 | Tragic 19.8% |
| Yuman | 0.0 /100 | #338 | Tragic 20.2% |
| Crow | 0.0 /100 | #339 | Tragic 20.7% |
| Yup'ik | 0.0 /100 | #340 | Tragic 20.8% |
| Hopi | 0.0 /100 | #341 | Tragic 20.8% |
| Immigrants | Yemen | 0.0 /100 | #342 | Tragic 21.5% |
| Pima | 0.0 /100 | #343 | Tragic 21.9% |
| Lumbee | 0.0 /100 | #344 | Tragic 21.9% |
| Navajo | 0.0 /100 | #345 | Tragic 23.1% |
| Puerto Ricans | 0.0 /100 | #346 | Tragic 23.7% |
| Tohono O'odham | 0.0 /100 | #347 | Tragic 24.4% |
Demographics Similar to Immigrants from Hong Kong by Poverty
In terms of poverty, the demographic groups most similar to Immigrants from Hong Kong are Bhutanese (10.4%, a difference of 0.22%), Immigrants from Bolivia (10.4%, a difference of 0.31%), Bolivian (10.4%, a difference of 0.32%), Immigrants from Lithuania (10.3%, a difference of 0.57%), and Lithuanian (10.5%, a difference of 0.62%).
| Demographics | Rating | Rank | Poverty |
| Assyrians/Chaldeans/Syriacs | 99.9 /100 | #6 | Exceptional 10.1% |
| Filipinos | 99.9 /100 | #7 | Exceptional 10.1% |
| Maltese | 99.9 /100 | #8 | Exceptional 10.2% |
| Immigrants | South Central Asia | 99.9 /100 | #9 | Exceptional 10.2% |
| Bulgarians | 99.9 /100 | #10 | Exceptional 10.2% |
| Immigrants | Lithuania | 99.9 /100 | #11 | Exceptional 10.3% |
| Bhutanese | 99.8 /100 | #12 | Exceptional 10.4% |
| Immigrants | Hong Kong | 99.8 /100 | #13 | Exceptional 10.4% |
| Immigrants | Bolivia | 99.8 /100 | #14 | Exceptional 10.4% |
| Bolivians | 99.8 /100 | #15 | Exceptional 10.4% |
| Lithuanians | 99.8 /100 | #16 | Exceptional 10.5% |
| Norwegians | 99.8 /100 | #17 | Exceptional 10.5% |
| Latvians | 99.8 /100 | #18 | Exceptional 10.5% |
| Immigrants | Scotland | 99.7 /100 | #19 | Exceptional 10.6% |
| Immigrants | North Macedonia | 99.7 /100 | #20 | Exceptional 10.6% |