Lumbee vs Houma Male Poverty
COMPARE
Lumbee
Houma
Male Poverty
Male Poverty Comparison
Lumbee
Houma
20.2%
MALE POVERTY
0.0/ 100
METRIC RATING
341st/ 347
METRIC RANK
16.7%
MALE POVERTY
0.0/ 100
METRIC RATING
332nd/ 347
METRIC RANK
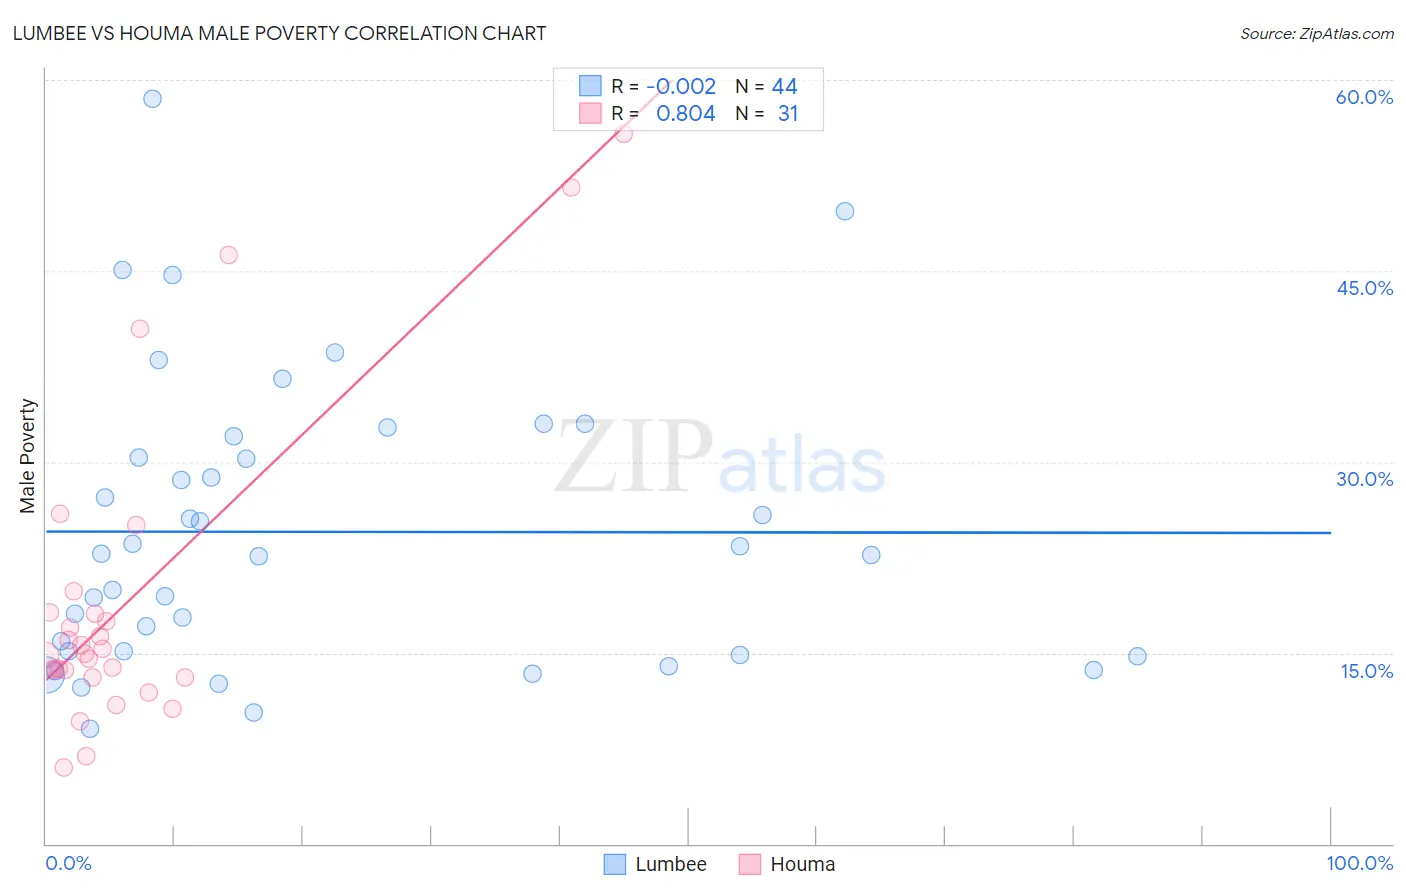
Lumbee vs Houma Male Poverty Correlation Chart
The statistical analysis conducted on geographies consisting of 92,248,821 people shows no correlation between the proportion of Lumbee and poverty level among males in the United States with a correlation coefficient (R) of -0.002 and weighted average of 20.2%. Similarly, the statistical analysis conducted on geographies consisting of 36,790,464 people shows a very strong positive correlation between the proportion of Houma and poverty level among males in the United States with a correlation coefficient (R) of 0.804 and weighted average of 16.7%, a difference of 20.9%.
Male Poverty Correlation Summary
| Measurement | Lumbee | Houma |
| Minimum | 9.1% | 6.0% |
| Maximum | 58.5% | 55.7% |
| Range | 49.5% | 49.7% |
| Mean | 24.5% | 19.1% |
| Median | 22.7% | 14.9% |
| Interquartile 25% (IQ1) | 15.0% | 13.1% |
| Interquartile 75% (IQ3) | 31.2% | 18.1% |
| Interquartile Range (IQR) | 16.2% | 5.1% |
| Standard Deviation (Sample) | 11.3% | 12.4% |
| Standard Deviation (Population) | 11.2% | 12.2% |
Demographics Similar to Lumbee and Houma by Male Poverty
In terms of male poverty, the demographic groups most similar to Lumbee are Immigrants from Yemen (20.1%, a difference of 0.30%), Pima (20.4%, a difference of 0.78%), Yup'ik (20.4%, a difference of 0.88%), Hopi (20.8%, a difference of 3.0%), and Yuman (19.5%, a difference of 3.4%). Similarly, the demographic groups most similar to Houma are Native/Alaskan (16.9%, a difference of 1.2%), Ute (16.2%, a difference of 3.0%), Immigrants from Dominican Republic (16.2%, a difference of 3.3%), Dominican (16.1%, a difference of 4.0%), and Cheyenne (17.6%, a difference of 5.4%).
| Demographics | Rating | Rank | Male Poverty |
| Central American Indians | 0.0 /100 | #326 | Tragic 15.3% |
| Paiute | 0.0 /100 | #327 | Tragic 15.8% |
| Blacks/African Americans | 0.0 /100 | #328 | Tragic 15.8% |
| Dominicans | 0.0 /100 | #329 | Tragic 16.1% |
| Immigrants | Dominican Republic | 0.0 /100 | #330 | Tragic 16.2% |
| Ute | 0.0 /100 | #331 | Tragic 16.2% |
| Houma | 0.0 /100 | #332 | Tragic 16.7% |
| Natives/Alaskans | 0.0 /100 | #333 | Tragic 16.9% |
| Cheyenne | 0.0 /100 | #334 | Tragic 17.6% |
| Apache | 0.0 /100 | #335 | Tragic 17.7% |
| Pueblo | 0.0 /100 | #336 | Tragic 18.5% |
| Sioux | 0.0 /100 | #337 | Tragic 18.7% |
| Crow | 0.0 /100 | #338 | Tragic 19.1% |
| Yuman | 0.0 /100 | #339 | Tragic 19.5% |
| Immigrants | Yemen | 0.0 /100 | #340 | Tragic 20.1% |
| Lumbee | 0.0 /100 | #341 | Tragic 20.2% |
| Pima | 0.0 /100 | #342 | Tragic 20.4% |
| Yup'ik | 0.0 /100 | #343 | Tragic 20.4% |
| Hopi | 0.0 /100 | #344 | Tragic 20.8% |
| Puerto Ricans | 0.0 /100 | #345 | Tragic 22.0% |
| Navajo | 0.0 /100 | #346 | Tragic 22.3% |