Lithuanian vs Immigrants from Singapore Family Poverty
COMPARE
Lithuanian
Immigrants from Singapore
Family Poverty
Family Poverty Comparison
Lithuanians
Immigrants from Singapore
7.2%
FAMILY POVERTY
99.8/ 100
METRIC RATING
15th/ 347
METRIC RANK
7.1%
FAMILY POVERTY
99.8/ 100
METRIC RATING
11th/ 347
METRIC RANK
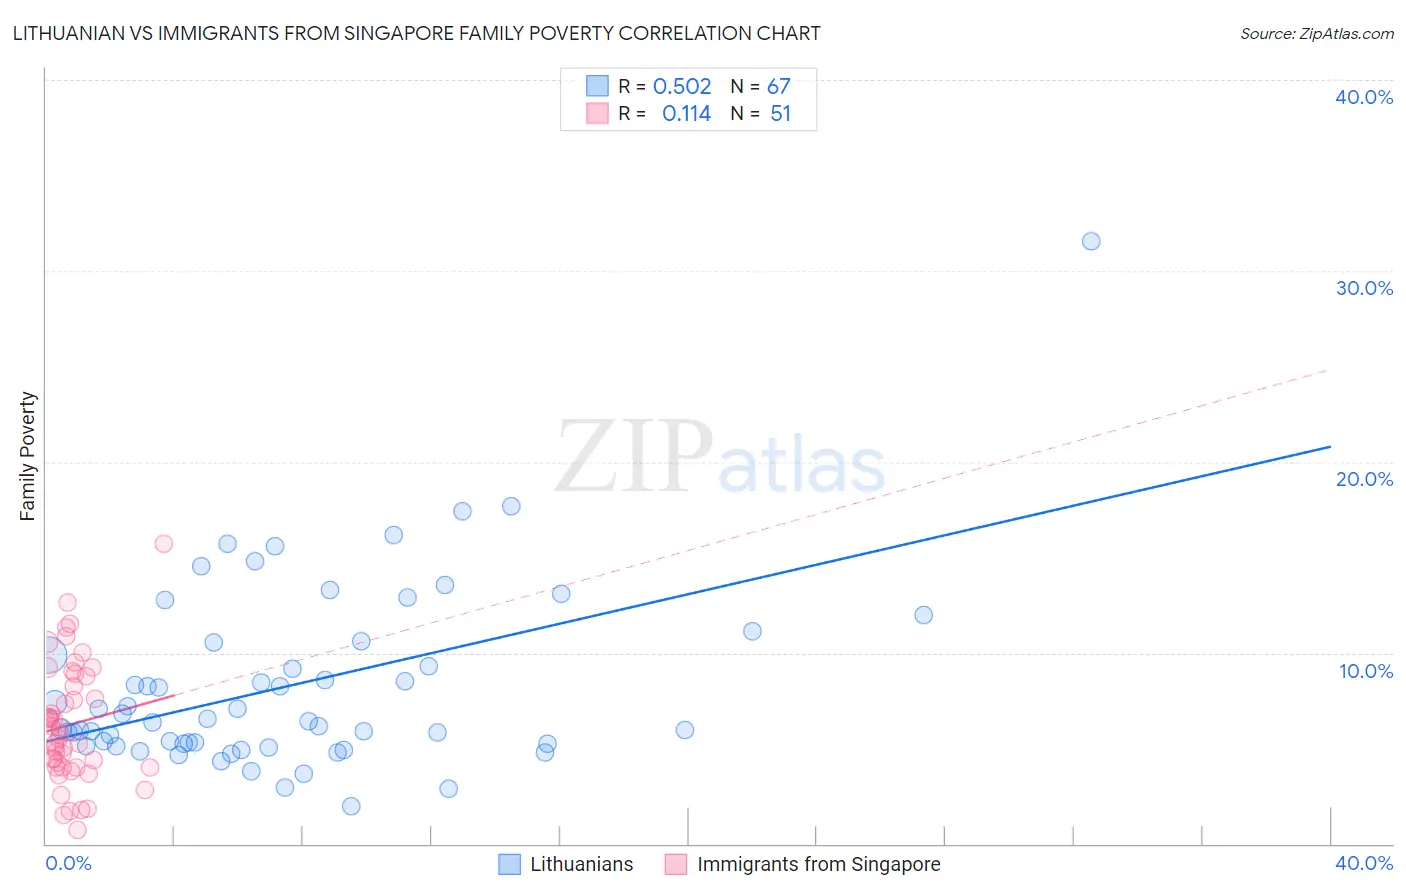
Lithuanian vs Immigrants from Singapore Family Poverty Correlation Chart
The statistical analysis conducted on geographies consisting of 420,202,329 people shows a substantial positive correlation between the proportion of Lithuanians and poverty level among families in the United States with a correlation coefficient (R) of 0.502 and weighted average of 7.2%. Similarly, the statistical analysis conducted on geographies consisting of 137,322,674 people shows a poor positive correlation between the proportion of Immigrants from Singapore and poverty level among families in the United States with a correlation coefficient (R) of 0.114 and weighted average of 7.1%, a difference of 1.2%.
Family Poverty Correlation Summary
| Measurement | Lithuanian | Immigrants from Singapore |
| Minimum | 2.0% | 0.70% |
| Maximum | 31.6% | 15.7% |
| Range | 29.6% | 15.0% |
| Mean | 8.3% | 6.2% |
| Median | 6.4% | 5.7% |
| Interquartile 25% (IQ1) | 5.2% | 4.0% |
| Interquartile 75% (IQ3) | 10.5% | 8.8% |
| Interquartile Range (IQR) | 5.3% | 4.8% |
| Standard Deviation (Sample) | 4.8% | 3.2% |
| Standard Deviation (Population) | 4.8% | 3.1% |
Demographics Similar to Lithuanians and Immigrants from Singapore by Family Poverty
In terms of family poverty, the demographic groups most similar to Lithuanians are Immigrants from South Central Asia (7.2%, a difference of 0.27%), Luxembourger (7.2%, a difference of 0.50%), Immigrants from Lithuania (7.2%, a difference of 0.51%), Eastern European (7.2%, a difference of 0.81%), and Swedish (7.1%, a difference of 0.88%). Similarly, the demographic groups most similar to Immigrants from Singapore are Bulgarian (7.1%, a difference of 0.010%), Latvian (7.1%, a difference of 0.27%), Maltese (7.1%, a difference of 0.29%), Swedish (7.1%, a difference of 0.34%), and Iranian (7.1%, a difference of 0.34%).
| Demographics | Rating | Rank | Family Poverty |
| Immigrants | Taiwan | 100.0 /100 | #3 | Exceptional 6.6% |
| Filipinos | 100.0 /100 | #4 | Exceptional 6.6% |
| Thais | 100.0 /100 | #5 | Exceptional 6.7% |
| Norwegians | 99.9 /100 | #6 | Exceptional 6.9% |
| Immigrants | Ireland | 99.9 /100 | #7 | Exceptional 7.0% |
| Bhutanese | 99.9 /100 | #8 | Exceptional 7.0% |
| Latvians | 99.9 /100 | #9 | Exceptional 7.1% |
| Bulgarians | 99.8 /100 | #10 | Exceptional 7.1% |
| Immigrants | Singapore | 99.8 /100 | #11 | Exceptional 7.1% |
| Maltese | 99.8 /100 | #12 | Exceptional 7.1% |
| Swedes | 99.8 /100 | #13 | Exceptional 7.1% |
| Iranians | 99.8 /100 | #14 | Exceptional 7.1% |
| Lithuanians | 99.8 /100 | #15 | Exceptional 7.2% |
| Immigrants | South Central Asia | 99.8 /100 | #16 | Exceptional 7.2% |
| Luxembourgers | 99.8 /100 | #17 | Exceptional 7.2% |
| Immigrants | Lithuania | 99.8 /100 | #18 | Exceptional 7.2% |
| Eastern Europeans | 99.7 /100 | #19 | Exceptional 7.2% |
| Immigrants | Hong Kong | 99.7 /100 | #20 | Exceptional 7.3% |
| Immigrants | Iran | 99.7 /100 | #21 | Exceptional 7.3% |
| Danes | 99.7 /100 | #22 | Exceptional 7.3% |
| Assyrians/Chaldeans/Syriacs | 99.7 /100 | #23 | Exceptional 7.3% |