Lithuanian vs British Single Female Poverty
COMPARE
Lithuanian
British
Single Female Poverty
Single Female Poverty Comparison
Lithuanians
British
19.2%
SINGLE FEMALE POVERTY
99.6/ 100
METRIC RATING
62nd/ 347
METRIC RANK
21.1%
SINGLE FEMALE POVERTY
42.9/ 100
METRIC RATING
179th/ 347
METRIC RANK
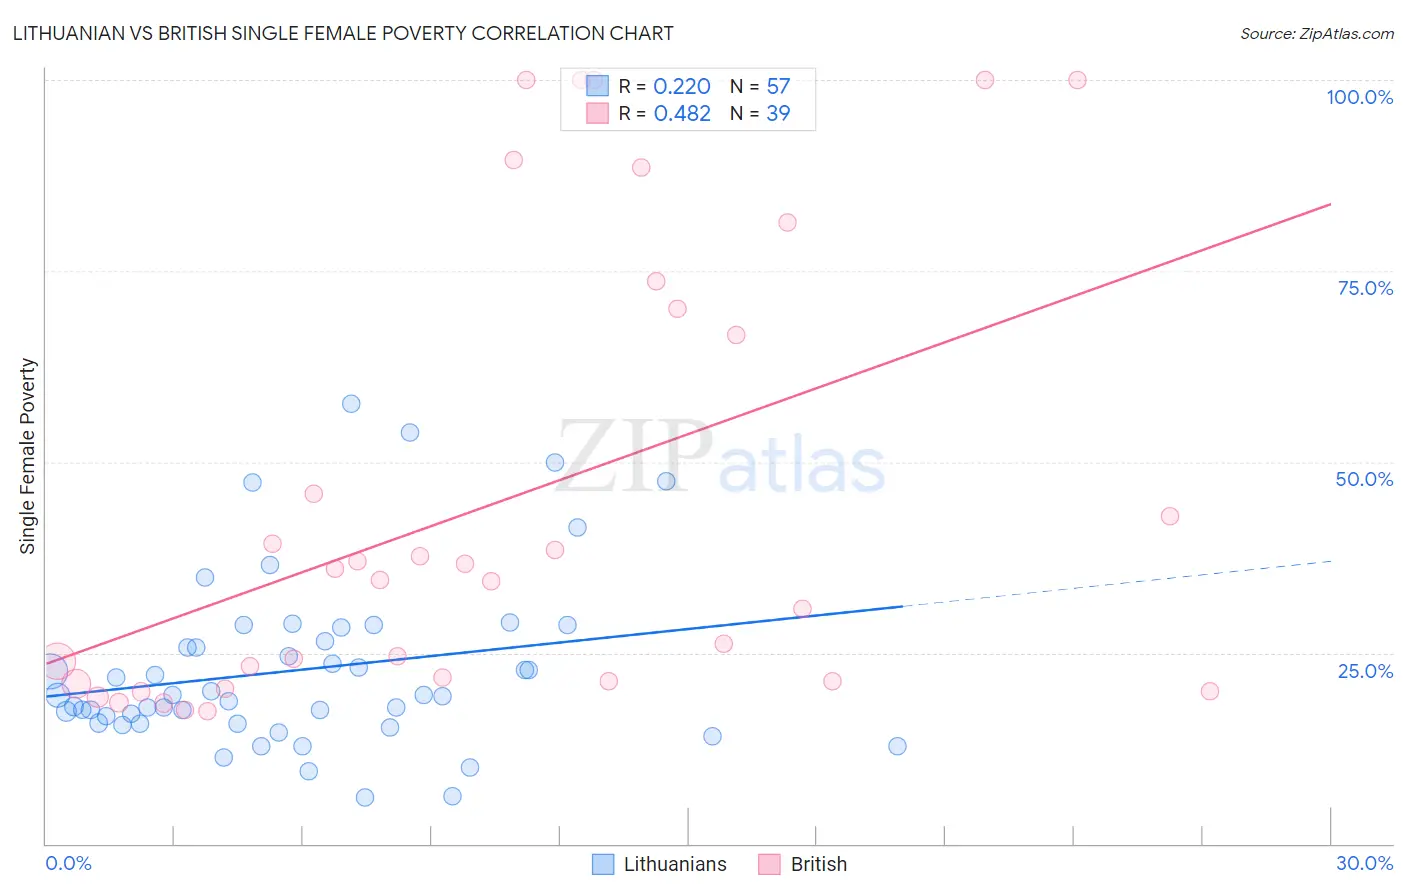
Lithuanian vs British Single Female Poverty Correlation Chart
The statistical analysis conducted on geographies consisting of 412,150,693 people shows a weak positive correlation between the proportion of Lithuanians and poverty level among single females in the United States with a correlation coefficient (R) of 0.220 and weighted average of 19.2%. Similarly, the statistical analysis conducted on geographies consisting of 516,545,848 people shows a moderate positive correlation between the proportion of British and poverty level among single females in the United States with a correlation coefficient (R) of 0.482 and weighted average of 21.1%, a difference of 9.9%.
Single Female Poverty Correlation Summary
| Measurement | Lithuanian | British |
| Minimum | 6.1% | 17.3% |
| Maximum | 57.6% | 100.0% |
| Range | 51.5% | 82.7% |
| Mean | 22.8% | 44.7% |
| Median | 19.4% | 34.5% |
| Interquartile 25% (IQ1) | 15.7% | 21.2% |
| Interquartile 75% (IQ3) | 27.4% | 70.0% |
| Interquartile Range (IQR) | 11.7% | 48.8% |
| Standard Deviation (Sample) | 11.3% | 29.4% |
| Standard Deviation (Population) | 11.2% | 29.0% |
Similar Demographics by Single Female Poverty
Demographics Similar to Lithuanians by Single Female Poverty
In terms of single female poverty, the demographic groups most similar to Lithuanians are Cambodian (19.2%, a difference of 0.050%), Russian (19.2%, a difference of 0.070%), Immigrants from Northern Europe (19.2%, a difference of 0.12%), Immigrants from Europe (19.2%, a difference of 0.13%), and Cypriot (19.2%, a difference of 0.15%).
| Demographics | Rating | Rank | Single Female Poverty |
| Immigrants | Vietnam | 99.7 /100 | #55 | Exceptional 19.1% |
| Immigrants | Fiji | 99.7 /100 | #56 | Exceptional 19.1% |
| Eastern Europeans | 99.7 /100 | #57 | Exceptional 19.1% |
| Immigrants | Bulgaria | 99.7 /100 | #58 | Exceptional 19.1% |
| Sri Lankans | 99.6 /100 | #59 | Exceptional 19.2% |
| Russians | 99.6 /100 | #60 | Exceptional 19.2% |
| Cambodians | 99.6 /100 | #61 | Exceptional 19.2% |
| Lithuanians | 99.6 /100 | #62 | Exceptional 19.2% |
| Immigrants | Northern Europe | 99.6 /100 | #63 | Exceptional 19.2% |
| Immigrants | Europe | 99.6 /100 | #64 | Exceptional 19.2% |
| Cypriots | 99.6 /100 | #65 | Exceptional 19.2% |
| Palestinians | 99.6 /100 | #66 | Exceptional 19.2% |
| Immigrants | Egypt | 99.6 /100 | #67 | Exceptional 19.2% |
| Laotians | 99.5 /100 | #68 | Exceptional 19.3% |
| Paraguayans | 99.5 /100 | #69 | Exceptional 19.3% |
Demographics Similar to British by Single Female Poverty
In terms of single female poverty, the demographic groups most similar to British are Spanish American Indian (21.1%, a difference of 0.030%), European (21.1%, a difference of 0.040%), Immigrants from Bosnia and Herzegovina (21.1%, a difference of 0.12%), Scandinavian (21.1%, a difference of 0.14%), and Slavic (21.1%, a difference of 0.15%).
| Demographics | Rating | Rank | Single Female Poverty |
| Guyanese | 52.0 /100 | #172 | Average 21.0% |
| Immigrants | Guyana | 50.6 /100 | #173 | Average 21.0% |
| Cubans | 50.0 /100 | #174 | Average 21.0% |
| Czechs | 46.8 /100 | #175 | Average 21.0% |
| Canadians | 45.4 /100 | #176 | Average 21.1% |
| Scandinavians | 45.2 /100 | #177 | Average 21.1% |
| Immigrants | Bosnia and Herzegovina | 44.9 /100 | #178 | Average 21.1% |
| British | 42.9 /100 | #179 | Average 21.1% |
| Spanish American Indians | 42.5 /100 | #180 | Average 21.1% |
| Europeans | 42.3 /100 | #181 | Average 21.1% |
| Slavs | 40.5 /100 | #182 | Average 21.1% |
| Slovaks | 39.7 /100 | #183 | Fair 21.1% |
| Hungarians | 39.6 /100 | #184 | Fair 21.1% |
| Immigrants | Cambodia | 38.2 /100 | #185 | Fair 21.2% |
| Hawaiians | 37.7 /100 | #186 | Fair 21.2% |