Lithuanian vs American Single Female Poverty
COMPARE
Lithuanian
American
Single Female Poverty
Single Female Poverty Comparison
Lithuanians
Americans
19.2%
SINGLE FEMALE POVERTY
99.6/ 100
METRIC RATING
62nd/ 347
METRIC RANK
24.5%
SINGLE FEMALE POVERTY
0.0/ 100
METRIC RATING
293rd/ 347
METRIC RANK
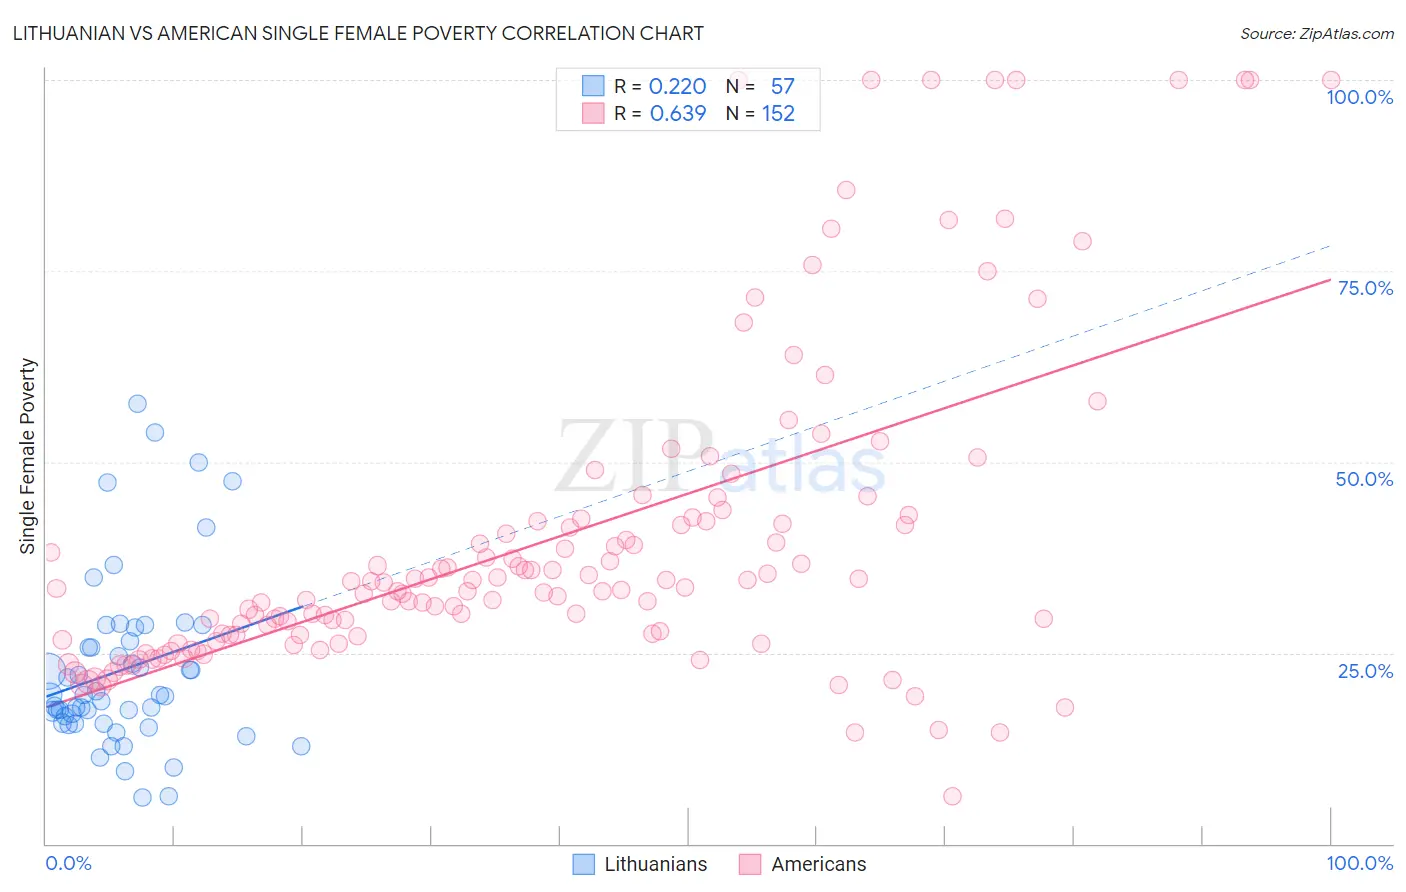
Lithuanian vs American Single Female Poverty Correlation Chart
The statistical analysis conducted on geographies consisting of 412,150,693 people shows a weak positive correlation between the proportion of Lithuanians and poverty level among single females in the United States with a correlation coefficient (R) of 0.220 and weighted average of 19.2%. Similarly, the statistical analysis conducted on geographies consisting of 559,828,526 people shows a significant positive correlation between the proportion of Americans and poverty level among single females in the United States with a correlation coefficient (R) of 0.639 and weighted average of 24.5%, a difference of 27.7%.
Single Female Poverty Correlation Summary
| Measurement | Lithuanian | American |
| Minimum | 6.1% | 6.2% |
| Maximum | 57.6% | 100.0% |
| Range | 51.5% | 93.8% |
| Mean | 22.8% | 39.7% |
| Median | 19.4% | 33.3% |
| Interquartile 25% (IQ1) | 15.7% | 27.3% |
| Interquartile 75% (IQ3) | 27.4% | 42.3% |
| Interquartile Range (IQR) | 11.7% | 15.0% |
| Standard Deviation (Sample) | 11.3% | 20.8% |
| Standard Deviation (Population) | 11.2% | 20.7% |
Similar Demographics by Single Female Poverty
Demographics Similar to Lithuanians by Single Female Poverty
In terms of single female poverty, the demographic groups most similar to Lithuanians are Cambodian (19.2%, a difference of 0.050%), Russian (19.2%, a difference of 0.070%), Immigrants from Northern Europe (19.2%, a difference of 0.12%), Immigrants from Europe (19.2%, a difference of 0.13%), and Cypriot (19.2%, a difference of 0.15%).
| Demographics | Rating | Rank | Single Female Poverty |
| Immigrants | Vietnam | 99.7 /100 | #55 | Exceptional 19.1% |
| Immigrants | Fiji | 99.7 /100 | #56 | Exceptional 19.1% |
| Eastern Europeans | 99.7 /100 | #57 | Exceptional 19.1% |
| Immigrants | Bulgaria | 99.7 /100 | #58 | Exceptional 19.1% |
| Sri Lankans | 99.6 /100 | #59 | Exceptional 19.2% |
| Russians | 99.6 /100 | #60 | Exceptional 19.2% |
| Cambodians | 99.6 /100 | #61 | Exceptional 19.2% |
| Lithuanians | 99.6 /100 | #62 | Exceptional 19.2% |
| Immigrants | Northern Europe | 99.6 /100 | #63 | Exceptional 19.2% |
| Immigrants | Europe | 99.6 /100 | #64 | Exceptional 19.2% |
| Cypriots | 99.6 /100 | #65 | Exceptional 19.2% |
| Palestinians | 99.6 /100 | #66 | Exceptional 19.2% |
| Immigrants | Egypt | 99.6 /100 | #67 | Exceptional 19.2% |
| Laotians | 99.5 /100 | #68 | Exceptional 19.3% |
| Paraguayans | 99.5 /100 | #69 | Exceptional 19.3% |
Demographics Similar to Americans by Single Female Poverty
In terms of single female poverty, the demographic groups most similar to Americans are Alsatian (24.5%, a difference of 0.080%), French American Indian (24.6%, a difference of 0.15%), Osage (24.4%, a difference of 0.44%), Hispanic or Latino (24.6%, a difference of 0.49%), and African (24.8%, a difference of 0.98%).
| Demographics | Rating | Rank | Single Female Poverty |
| Cree | 0.0 /100 | #286 | Tragic 24.1% |
| Bangladeshis | 0.0 /100 | #287 | Tragic 24.2% |
| Spanish Americans | 0.0 /100 | #288 | Tragic 24.2% |
| U.S. Virgin Islanders | 0.0 /100 | #289 | Tragic 24.2% |
| Indonesians | 0.0 /100 | #290 | Tragic 24.3% |
| Osage | 0.0 /100 | #291 | Tragic 24.4% |
| Alsatians | 0.0 /100 | #292 | Tragic 24.5% |
| Americans | 0.0 /100 | #293 | Tragic 24.5% |
| French American Indians | 0.0 /100 | #294 | Tragic 24.6% |
| Hispanics or Latinos | 0.0 /100 | #295 | Tragic 24.6% |
| Africans | 0.0 /100 | #296 | Tragic 24.8% |
| Immigrants | Central America | 0.0 /100 | #297 | Tragic 24.8% |
| Yaqui | 0.0 /100 | #298 | Tragic 24.9% |
| Mexicans | 0.0 /100 | #299 | Tragic 25.0% |
| Blackfeet | 0.0 /100 | #300 | Tragic 25.1% |