Liberian vs Sioux Female Poverty Among 18-24 Year Olds
COMPARE
Liberian
Sioux
Female Poverty Among 18-24 Year Olds
Female Poverty Among 18-24 Year Olds Comparison
Liberians
Sioux
20.6%
FEMALE POVERTY AMONG 18-24 YEAR OLDS
11.6/ 100
METRIC RATING
212th/ 347
METRIC RANK
28.6%
FEMALE POVERTY AMONG 18-24 YEAR OLDS
0.0/ 100
METRIC RATING
340th/ 347
METRIC RANK
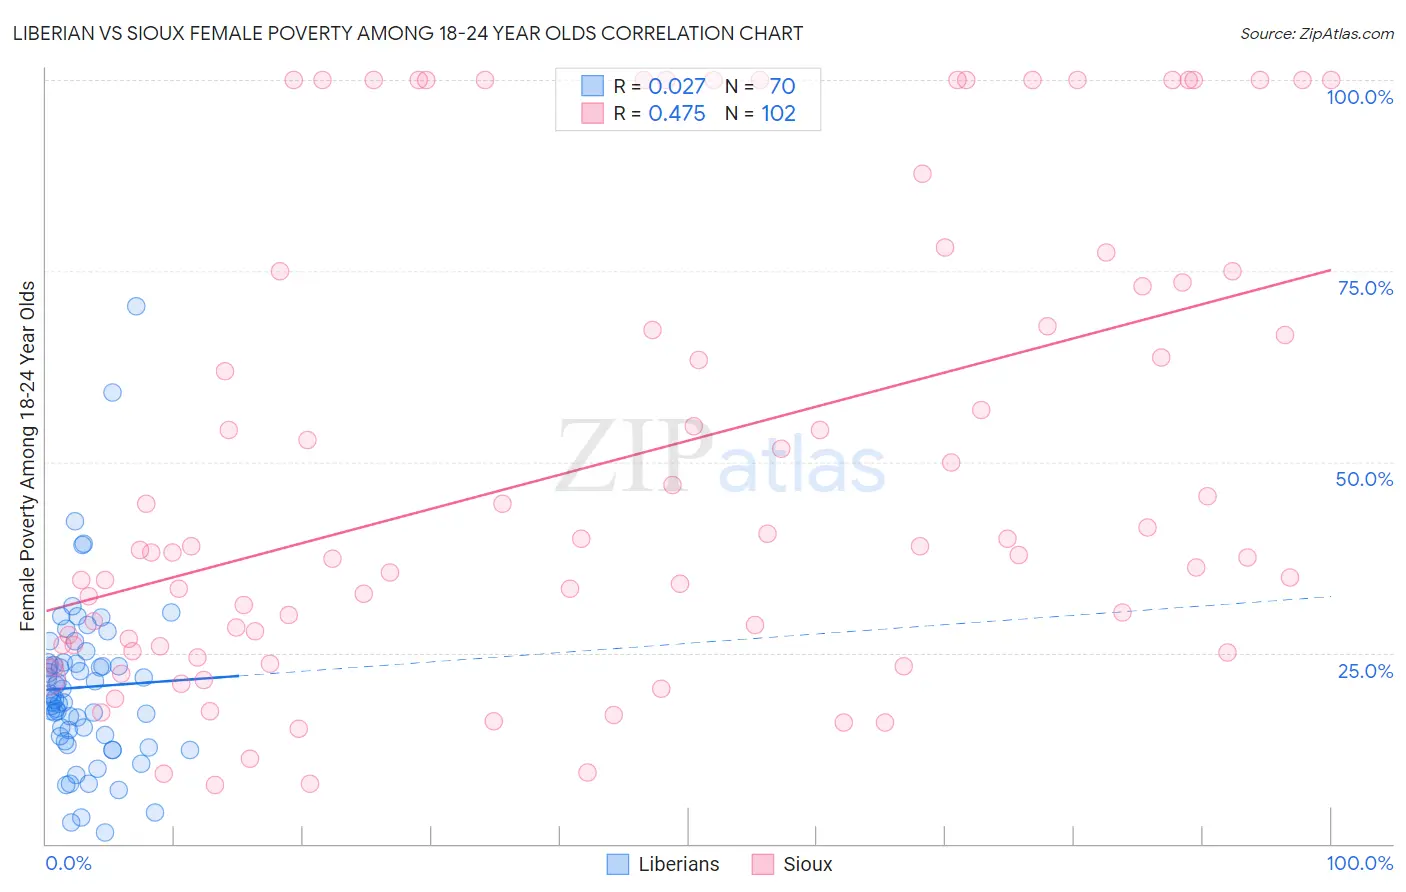
Liberian vs Sioux Female Poverty Among 18-24 Year Olds Correlation Chart
The statistical analysis conducted on geographies consisting of 117,354,593 people shows no correlation between the proportion of Liberians and poverty level among females between the ages 18 and 24 in the United States with a correlation coefficient (R) of 0.027 and weighted average of 20.6%. Similarly, the statistical analysis conducted on geographies consisting of 230,923,136 people shows a moderate positive correlation between the proportion of Sioux and poverty level among females between the ages 18 and 24 in the United States with a correlation coefficient (R) of 0.475 and weighted average of 28.6%, a difference of 38.7%.
Female Poverty Among 18-24 Year Olds Correlation Summary
| Measurement | Liberian | Sioux |
| Minimum | 1.5% | 7.7% |
| Maximum | 70.3% | 100.0% |
| Range | 68.8% | 92.3% |
| Mean | 20.5% | 49.6% |
| Median | 19.1% | 38.3% |
| Interquartile 25% (IQ1) | 14.1% | 26.1% |
| Interquartile 75% (IQ3) | 23.6% | 73.5% |
| Interquartile Range (IQR) | 9.5% | 47.4% |
| Standard Deviation (Sample) | 11.3% | 30.2% |
| Standard Deviation (Population) | 11.3% | 30.0% |
Similar Demographics by Female Poverty Among 18-24 Year Olds
Demographics Similar to Liberians by Female Poverty Among 18-24 Year Olds
In terms of female poverty among 18-24 year olds, the demographic groups most similar to Liberians are Northern European (20.6%, a difference of 0.010%), Immigrants from South Africa (20.6%, a difference of 0.12%), Spanish (20.6%, a difference of 0.15%), Immigrants from Western Africa (20.6%, a difference of 0.17%), and Immigrants from Western Europe (20.6%, a difference of 0.21%).
| Demographics | Rating | Rank | Female Poverty Among 18-24 Year Olds |
| English | 16.7 /100 | #205 | Poor 20.5% |
| Hispanics or Latinos | 16.6 /100 | #206 | Poor 20.5% |
| Spaniards | 16.3 /100 | #207 | Poor 20.5% |
| Dutch | 15.9 /100 | #208 | Poor 20.5% |
| Arabs | 15.5 /100 | #209 | Poor 20.5% |
| Immigrants | Ghana | 14.3 /100 | #210 | Poor 20.5% |
| Immigrants | Western Europe | 13.5 /100 | #211 | Poor 20.6% |
| Liberians | 11.6 /100 | #212 | Poor 20.6% |
| Northern Europeans | 11.6 /100 | #213 | Poor 20.6% |
| Immigrants | South Africa | 10.7 /100 | #214 | Poor 20.6% |
| Spanish | 10.4 /100 | #215 | Poor 20.6% |
| Immigrants | Western Africa | 10.2 /100 | #216 | Poor 20.6% |
| Immigrants | Laos | 9.7 /100 | #217 | Tragic 20.6% |
| Immigrants | Nepal | 9.6 /100 | #218 | Tragic 20.7% |
| Immigrants | Micronesia | 9.6 /100 | #219 | Tragic 20.7% |
Demographics Similar to Sioux by Female Poverty Among 18-24 Year Olds
In terms of female poverty among 18-24 year olds, the demographic groups most similar to Sioux are Pima (28.4%, a difference of 0.55%), Hopi (28.2%, a difference of 1.3%), Cheyenne (28.1%, a difference of 1.5%), Colville (29.0%, a difference of 1.6%), and Kiowa (29.2%, a difference of 2.3%).
| Demographics | Rating | Rank | Female Poverty Among 18-24 Year Olds |
| Apache | 0.0 /100 | #333 | Tragic 26.3% |
| Pueblo | 0.0 /100 | #334 | Tragic 26.9% |
| Yup'ik | 0.0 /100 | #335 | Tragic 27.0% |
| Immigrants | Yemen | 0.0 /100 | #336 | Tragic 27.5% |
| Cheyenne | 0.0 /100 | #337 | Tragic 28.1% |
| Hopi | 0.0 /100 | #338 | Tragic 28.2% |
| Pima | 0.0 /100 | #339 | Tragic 28.4% |
| Sioux | 0.0 /100 | #340 | Tragic 28.6% |
| Colville | 0.0 /100 | #341 | Tragic 29.0% |
| Kiowa | 0.0 /100 | #342 | Tragic 29.2% |
| Puerto Ricans | 0.0 /100 | #343 | Tragic 29.8% |
| Navajo | 0.0 /100 | #344 | Tragic 30.3% |
| Tohono O'odham | 0.0 /100 | #345 | Tragic 31.0% |
| Lumbee | 0.0 /100 | #346 | Tragic 31.1% |
| Crow | 0.0 /100 | #347 | Tragic 33.2% |