Liberian vs Italian Female Poverty Among 18-24 Year Olds
COMPARE
Liberian
Italian
Female Poverty Among 18-24 Year Olds
Female Poverty Among 18-24 Year Olds Comparison
Liberians
Italians
20.6%
FEMALE POVERTY AMONG 18-24 YEAR OLDS
11.6/ 100
METRIC RATING
212th/ 347
METRIC RANK
18.3%
FEMALE POVERTY AMONG 18-24 YEAR OLDS
99.9/ 100
METRIC RATING
53rd/ 347
METRIC RANK
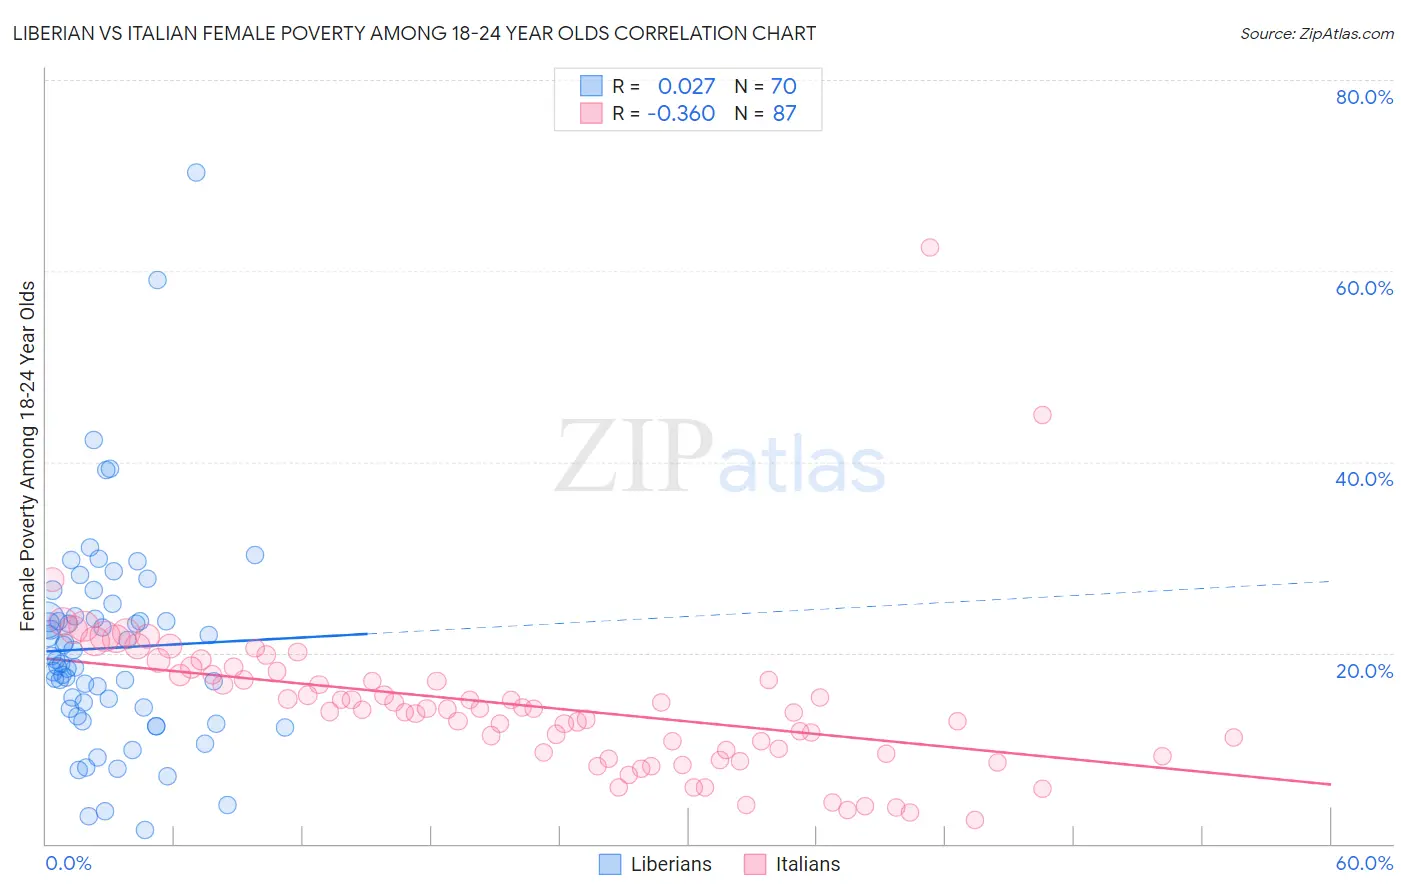
Liberian vs Italian Female Poverty Among 18-24 Year Olds Correlation Chart
The statistical analysis conducted on geographies consisting of 117,354,593 people shows no correlation between the proportion of Liberians and poverty level among females between the ages 18 and 24 in the United States with a correlation coefficient (R) of 0.027 and weighted average of 20.6%. Similarly, the statistical analysis conducted on geographies consisting of 539,657,862 people shows a mild negative correlation between the proportion of Italians and poverty level among females between the ages 18 and 24 in the United States with a correlation coefficient (R) of -0.360 and weighted average of 18.3%, a difference of 12.4%.
Female Poverty Among 18-24 Year Olds Correlation Summary
| Measurement | Liberian | Italian |
| Minimum | 1.5% | 2.4% |
| Maximum | 70.3% | 62.5% |
| Range | 68.8% | 60.1% |
| Mean | 20.5% | 14.5% |
| Median | 19.1% | 14.1% |
| Interquartile 25% (IQ1) | 14.1% | 9.5% |
| Interquartile 75% (IQ3) | 23.6% | 17.7% |
| Interquartile Range (IQR) | 9.5% | 8.2% |
| Standard Deviation (Sample) | 11.3% | 8.3% |
| Standard Deviation (Population) | 11.3% | 8.2% |
Similar Demographics by Female Poverty Among 18-24 Year Olds
Demographics Similar to Liberians by Female Poverty Among 18-24 Year Olds
In terms of female poverty among 18-24 year olds, the demographic groups most similar to Liberians are Northern European (20.6%, a difference of 0.010%), Immigrants from South Africa (20.6%, a difference of 0.12%), Spanish (20.6%, a difference of 0.15%), Immigrants from Western Africa (20.6%, a difference of 0.17%), and Immigrants from Western Europe (20.6%, a difference of 0.21%).
| Demographics | Rating | Rank | Female Poverty Among 18-24 Year Olds |
| English | 16.7 /100 | #205 | Poor 20.5% |
| Hispanics or Latinos | 16.6 /100 | #206 | Poor 20.5% |
| Spaniards | 16.3 /100 | #207 | Poor 20.5% |
| Dutch | 15.9 /100 | #208 | Poor 20.5% |
| Arabs | 15.5 /100 | #209 | Poor 20.5% |
| Immigrants | Ghana | 14.3 /100 | #210 | Poor 20.5% |
| Immigrants | Western Europe | 13.5 /100 | #211 | Poor 20.6% |
| Liberians | 11.6 /100 | #212 | Poor 20.6% |
| Northern Europeans | 11.6 /100 | #213 | Poor 20.6% |
| Immigrants | South Africa | 10.7 /100 | #214 | Poor 20.6% |
| Spanish | 10.4 /100 | #215 | Poor 20.6% |
| Immigrants | Western Africa | 10.2 /100 | #216 | Poor 20.6% |
| Immigrants | Laos | 9.7 /100 | #217 | Tragic 20.6% |
| Immigrants | Nepal | 9.6 /100 | #218 | Tragic 20.7% |
| Immigrants | Micronesia | 9.6 /100 | #219 | Tragic 20.7% |
Demographics Similar to Italians by Female Poverty Among 18-24 Year Olds
In terms of female poverty among 18-24 year olds, the demographic groups most similar to Italians are Immigrants from Ireland (18.3%, a difference of 0.090%), Immigrants from Egypt (18.4%, a difference of 0.22%), Albanian (18.4%, a difference of 0.23%), Argentinean (18.4%, a difference of 0.25%), and Immigrants from Italy (18.4%, a difference of 0.35%).
| Demographics | Rating | Rank | Female Poverty Among 18-24 Year Olds |
| Immigrants | Southern Europe | 100.0 /100 | #46 | Exceptional 18.2% |
| Asians | 100.0 /100 | #47 | Exceptional 18.2% |
| Sri Lankans | 100.0 /100 | #48 | Exceptional 18.2% |
| Bhutanese | 100.0 /100 | #49 | Exceptional 18.2% |
| Samoans | 100.0 /100 | #50 | Exceptional 18.2% |
| Immigrants | Eastern Europe | 99.9 /100 | #51 | Exceptional 18.2% |
| Immigrants | Ireland | 99.9 /100 | #52 | Exceptional 18.3% |
| Italians | 99.9 /100 | #53 | Exceptional 18.3% |
| Immigrants | Egypt | 99.9 /100 | #54 | Exceptional 18.4% |
| Albanians | 99.9 /100 | #55 | Exceptional 18.4% |
| Argentineans | 99.9 /100 | #56 | Exceptional 18.4% |
| Immigrants | Italy | 99.9 /100 | #57 | Exceptional 18.4% |
| Immigrants | Ukraine | 99.9 /100 | #58 | Exceptional 18.4% |
| Egyptians | 99.9 /100 | #59 | Exceptional 18.5% |
| Immigrants | Brazil | 99.8 /100 | #60 | Exceptional 18.5% |