Liberian vs Iroquois Poverty
COMPARE
Liberian
Iroquois
Poverty
Poverty Comparison
Liberians
Iroquois
14.1%
POVERTY
0.2/ 100
METRIC RATING
247th/ 347
METRIC RANK
14.5%
POVERTY
0.1/ 100
METRIC RATING
267th/ 347
METRIC RANK
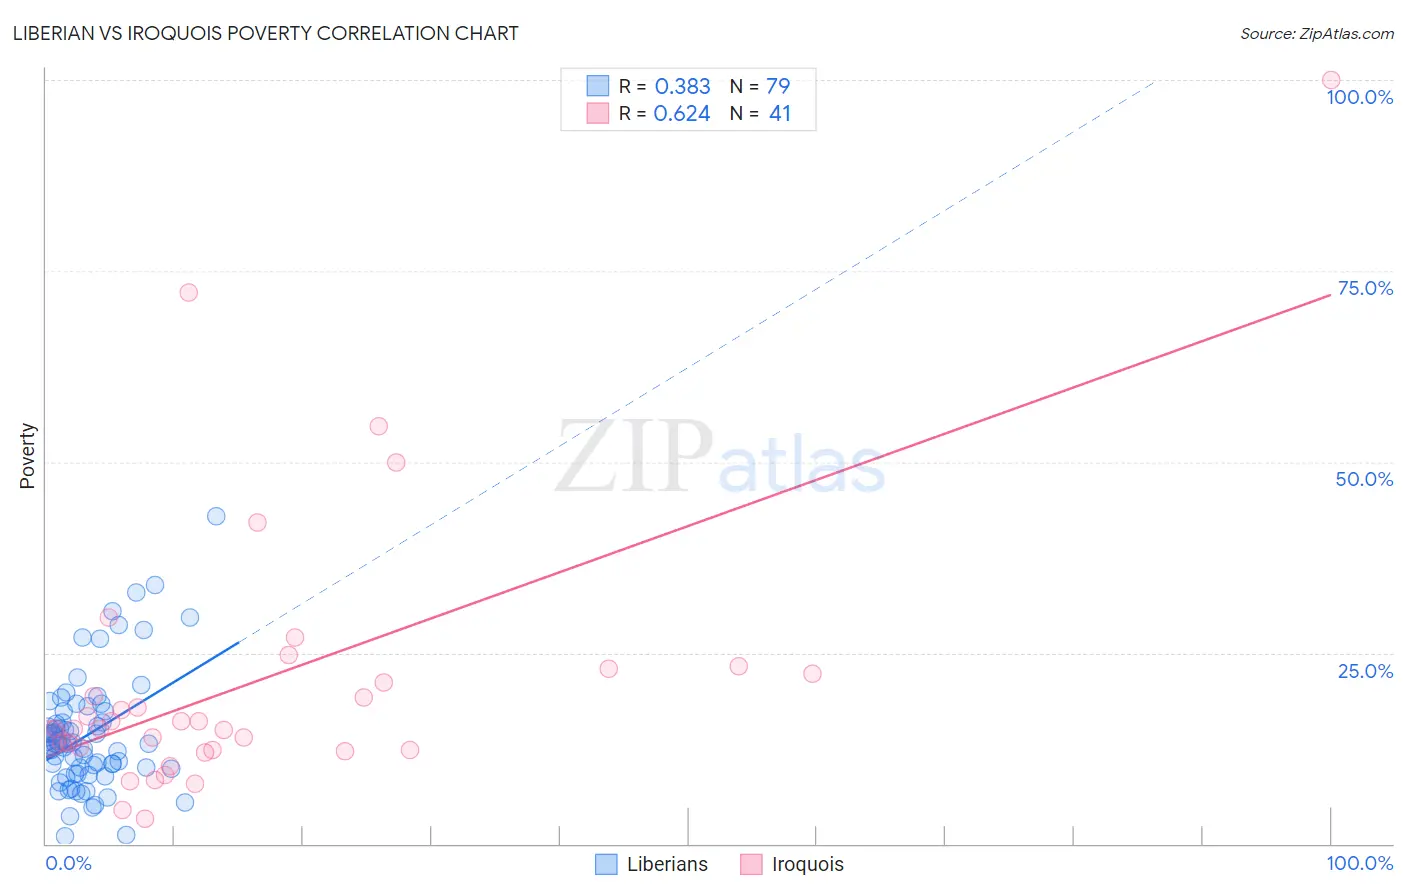
Liberian vs Iroquois Poverty Correlation Chart
The statistical analysis conducted on geographies consisting of 118,042,560 people shows a mild positive correlation between the proportion of Liberians and poverty level in the United States with a correlation coefficient (R) of 0.383 and weighted average of 14.1%. Similarly, the statistical analysis conducted on geographies consisting of 207,260,268 people shows a significant positive correlation between the proportion of Iroquois and poverty level in the United States with a correlation coefficient (R) of 0.624 and weighted average of 14.5%, a difference of 2.8%.
Poverty Correlation Summary
| Measurement | Liberian | Iroquois |
| Minimum | 1.0% | 3.3% |
| Maximum | 42.9% | 100.0% |
| Range | 41.9% | 96.7% |
| Mean | 14.3% | 21.2% |
| Median | 13.1% | 15.1% |
| Interquartile 25% (IQ1) | 9.8% | 12.3% |
| Interquartile 75% (IQ3) | 17.3% | 22.6% |
| Interquartile Range (IQR) | 7.5% | 10.3% |
| Standard Deviation (Sample) | 7.6% | 18.5% |
| Standard Deviation (Population) | 7.6% | 18.3% |
Demographics Similar to Liberians and Iroquois by Poverty
In terms of poverty, the demographic groups most similar to Liberians are Immigrants from Western Africa (14.1%, a difference of 0.020%), Immigrants from Ghana (14.2%, a difference of 0.11%), Cree (14.2%, a difference of 0.41%), Immigrants from Burma/Myanmar (14.2%, a difference of 0.50%), and Spanish American Indian (14.2%, a difference of 0.61%). Similarly, the demographic groups most similar to Iroquois are Guyanese (14.5%, a difference of 0.32%), Immigrants from Guyana (14.5%, a difference of 0.49%), Immigrants from Jamaica (14.4%, a difference of 0.61%), Jamaican (14.4%, a difference of 0.70%), and Immigrants from Liberia (14.4%, a difference of 1.1%).
| Demographics | Rating | Rank | Poverty |
| Liberians | 0.2 /100 | #247 | Tragic 14.1% |
| Immigrants | Western Africa | 0.2 /100 | #248 | Tragic 14.1% |
| Immigrants | Ghana | 0.2 /100 | #249 | Tragic 14.2% |
| Cree | 0.2 /100 | #250 | Tragic 14.2% |
| Immigrants | Burma/Myanmar | 0.2 /100 | #251 | Tragic 14.2% |
| Spanish American Indians | 0.2 /100 | #252 | Tragic 14.2% |
| Immigrants | Trinidad and Tobago | 0.2 /100 | #253 | Tragic 14.2% |
| Immigrants | El Salvador | 0.1 /100 | #254 | Tragic 14.3% |
| Immigrants | Ecuador | 0.1 /100 | #255 | Tragic 14.3% |
| Mexican American Indians | 0.1 /100 | #256 | Tragic 14.3% |
| Trinidadians and Tobagonians | 0.1 /100 | #257 | Tragic 14.3% |
| Ottawa | 0.1 /100 | #258 | Tragic 14.3% |
| Immigrants | Nicaragua | 0.1 /100 | #259 | Tragic 14.3% |
| Cape Verdeans | 0.1 /100 | #260 | Tragic 14.4% |
| Cherokee | 0.1 /100 | #261 | Tragic 14.4% |
| Immigrants | Liberia | 0.1 /100 | #262 | Tragic 14.4% |
| Jamaicans | 0.1 /100 | #263 | Tragic 14.4% |
| Immigrants | Jamaica | 0.1 /100 | #264 | Tragic 14.4% |
| Immigrants | Guyana | 0.1 /100 | #265 | Tragic 14.5% |
| Guyanese | 0.1 /100 | #266 | Tragic 14.5% |
| Iroquois | 0.1 /100 | #267 | Tragic 14.5% |