Liberian vs Immigrants from Vietnam Receiving Food Stamps
COMPARE
Liberian
Immigrants from Vietnam
Receiving Food Stamps
Receiving Food Stamps Comparison
Liberians
Immigrants from Vietnam
14.8%
RECEIVING FOOD STAMPS
0.1/ 100
METRIC RATING
276th/ 347
METRIC RANK
11.0%
RECEIVING FOOD STAMPS
86.7/ 100
METRIC RATING
141st/ 347
METRIC RANK
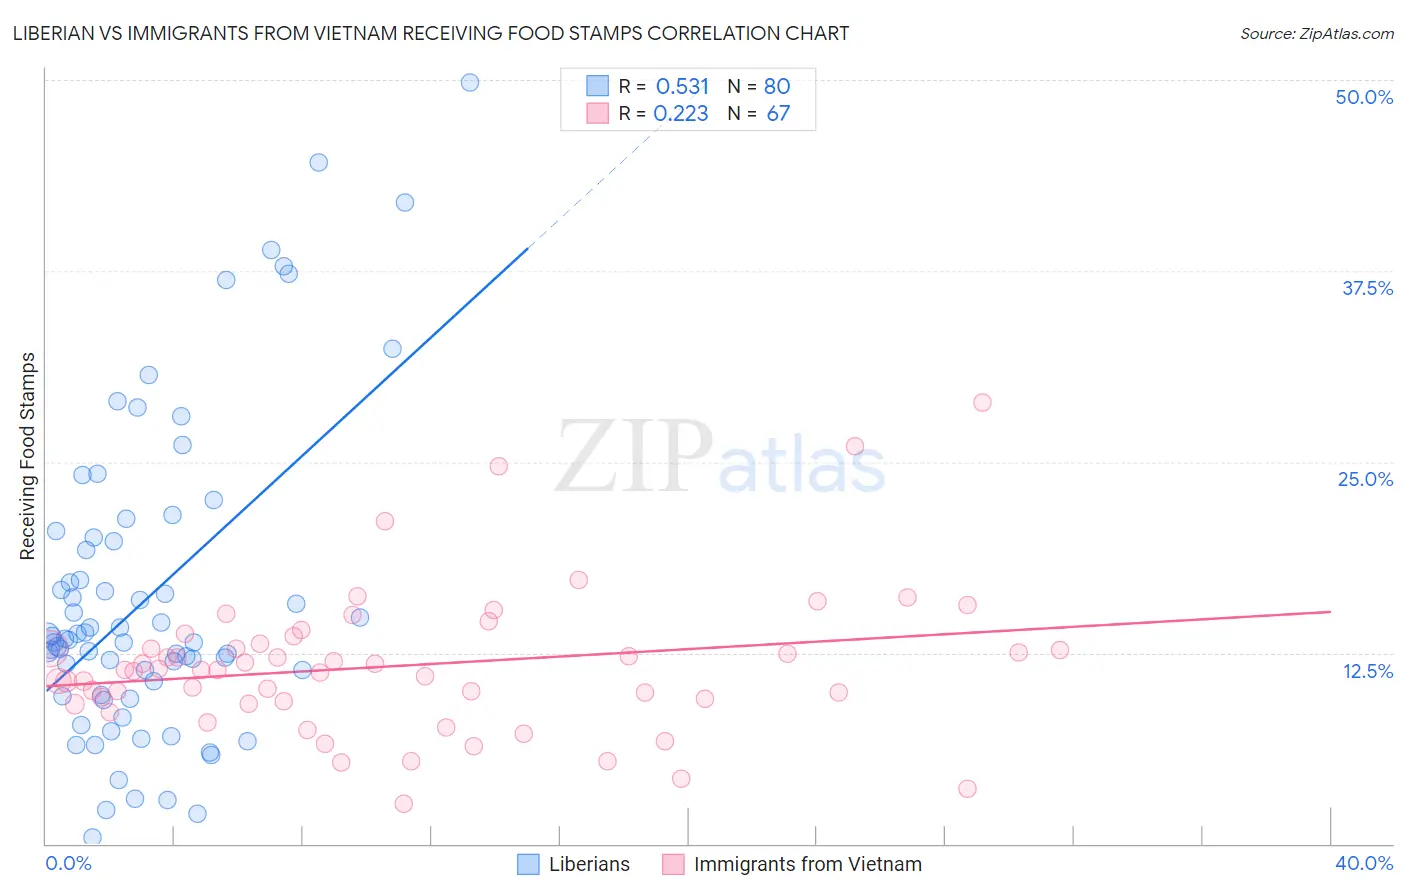
Liberian vs Immigrants from Vietnam Receiving Food Stamps Correlation Chart
The statistical analysis conducted on geographies consisting of 118,008,708 people shows a substantial positive correlation between the proportion of Liberians and percentage of population receiving government assistance and/or food stamps in the United States with a correlation coefficient (R) of 0.531 and weighted average of 14.8%. Similarly, the statistical analysis conducted on geographies consisting of 403,877,028 people shows a weak positive correlation between the proportion of Immigrants from Vietnam and percentage of population receiving government assistance and/or food stamps in the United States with a correlation coefficient (R) of 0.223 and weighted average of 11.0%, a difference of 35.0%.
Receiving Food Stamps Correlation Summary
| Measurement | Liberian | Immigrants from Vietnam |
| Minimum | 0.40% | 2.6% |
| Maximum | 49.8% | 28.8% |
| Range | 49.4% | 26.2% |
| Mean | 16.2% | 11.7% |
| Median | 13.4% | 11.4% |
| Interquartile 25% (IQ1) | 10.2% | 9.3% |
| Interquartile 75% (IQ3) | 19.9% | 13.1% |
| Interquartile Range (IQR) | 9.7% | 3.8% |
| Standard Deviation (Sample) | 10.3% | 4.7% |
| Standard Deviation (Population) | 10.2% | 4.7% |
Similar Demographics by Receiving Food Stamps
Demographics Similar to Liberians by Receiving Food Stamps
In terms of receiving food stamps, the demographic groups most similar to Liberians are Seminole (14.8%, a difference of 0.050%), Belizean (14.8%, a difference of 0.18%), Kiowa (14.9%, a difference of 0.45%), Ecuadorian (14.9%, a difference of 0.50%), and Ute (14.7%, a difference of 0.71%).
| Demographics | Rating | Rank | Receiving Food Stamps |
| Nepalese | 0.1 /100 | #269 | Tragic 14.6% |
| Mexicans | 0.1 /100 | #270 | Tragic 14.6% |
| Immigrants | Guatemala | 0.1 /100 | #271 | Tragic 14.6% |
| Chippewa | 0.1 /100 | #272 | Tragic 14.7% |
| Alaskan Athabascans | 0.1 /100 | #273 | Tragic 14.7% |
| Immigrants | Western Africa | 0.1 /100 | #274 | Tragic 14.7% |
| Ute | 0.1 /100 | #275 | Tragic 14.7% |
| Liberians | 0.1 /100 | #276 | Tragic 14.8% |
| Seminole | 0.1 /100 | #277 | Tragic 14.8% |
| Belizeans | 0.1 /100 | #278 | Tragic 14.8% |
| Kiowa | 0.0 /100 | #279 | Tragic 14.9% |
| Ecuadorians | 0.0 /100 | #280 | Tragic 14.9% |
| Spanish American Indians | 0.0 /100 | #281 | Tragic 14.9% |
| Immigrants | Central America | 0.0 /100 | #282 | Tragic 15.0% |
| Bangladeshis | 0.0 /100 | #283 | Tragic 15.0% |
Demographics Similar to Immigrants from Vietnam by Receiving Food Stamps
In terms of receiving food stamps, the demographic groups most similar to Immigrants from Vietnam are Chilean (11.0%, a difference of 0.17%), Immigrants from Northern Africa (11.0%, a difference of 0.25%), Celtic (10.9%, a difference of 0.36%), Syrian (11.0%, a difference of 0.40%), and Hungarian (11.0%, a difference of 0.51%).
| Demographics | Rating | Rank | Receiving Food Stamps |
| Immigrants | Brazil | 90.3 /100 | #134 | Exceptional 10.8% |
| Argentineans | 90.2 /100 | #135 | Exceptional 10.8% |
| Slovaks | 89.8 /100 | #136 | Excellent 10.8% |
| Immigrants | Eastern Europe | 89.8 /100 | #137 | Excellent 10.8% |
| Immigrants | Moldova | 88.5 /100 | #138 | Excellent 10.9% |
| Hmong | 88.4 /100 | #139 | Excellent 10.9% |
| Celtics | 87.8 /100 | #140 | Excellent 10.9% |
| Immigrants | Vietnam | 86.7 /100 | #141 | Excellent 11.0% |
| Chileans | 86.2 /100 | #142 | Excellent 11.0% |
| Immigrants | Northern Africa | 86.0 /100 | #143 | Excellent 11.0% |
| Syrians | 85.5 /100 | #144 | Excellent 11.0% |
| Hungarians | 85.1 /100 | #145 | Excellent 11.0% |
| Taiwanese | 84.2 /100 | #146 | Excellent 11.0% |
| Whites/Caucasians | 83.9 /100 | #147 | Excellent 11.1% |
| Immigrants | South Eastern Asia | 83.3 /100 | #148 | Excellent 11.1% |