Latvian vs Immigrants from Northern Europe Male Poverty

COMPARE

Latvian
Race
Ancestry
AfghanAfricanAlaska NativeAlaskan AthabascanAlbanianAleutAlsatianAmericanApacheArabArapahoArgentineanArmenianAssyrian/Chaldean/SyriacAustralianAustrianBahamianBangladeshiBarbadianBasqueBelgianBelizeanBermudanBhutaneseBlackfeetBolivianBrazilianBritishBritish West IndianBulgarianBurmeseCajunCambodianCanadianCape VerdeanCarpatho RusynCelticCentral AmericanCentral American IndianCherokeeCheyenneChickasawChileanChineseChippewaChoctawColombianColvilleComancheCosta RicanCreeCreekCroatianCrowCubanCypriotCzechCzechoslovakianDanishDelawareDominicanDutchDutch West IndianEastern EuropeanEcuadorianEgyptianEnglishEstonianEthiopianEuropeanFijianFilipinoFinnishFrenchFrench American IndianFrench CanadianGermanGerman RussianGhanaianGreekGuamanian/ChamorroGuatemalanGuyaneseHaitianHmongHonduranHopiHoumaHungarianIcelanderIndian (Asian)IndonesianInupiatIranianIraqiIrishIroquoisIsraeliItalianJamaicanJapaneseJordanianKenyanKiowaKoreanLaotianLatvianLebaneseLiberianLithuanianLumbeeLuxembourgerMacedonianMalaysianMalteseMarshalleseMenomineeMexicanMexican American IndianMongolianMoroccanNative HawaiianNavajoNepaleseNew ZealanderNicaraguanNigerianNorthern EuropeanNorwegianOkinawanOsageOttawaPaiutePakistaniPalestinianPanamanianParaguayanPennsylvania GermanPeruvianPimaPolishPortuguesePotawatomiPuebloPuerto RicanPuget Sound SalishRomanianRussianSalvadoranSamoanScandinavianScotch-IrishScottishSeminoleSenegaleseSerbianShoshoneSierra LeoneanSiouxSlavicSlovakSloveneSomaliSouth AfricanSouth AmericanSouth American IndianSoviet UnionSpaniardSpanishSpanish AmericanSpanish American IndianSri LankanSubsaharan AfricanSudaneseSwedishSwissSyrianTaiwaneseThaiTlingit-HaidaTohono O'OdhamTonganTrinidadian and TobagonianTsimshianTurkishU.S. Virgin IslanderUgandanUkrainianUruguayanUteVenezuelanVietnameseWelshWest IndianYakamaYaquiYugoslavianYumanYup'ikZimbabwean
Immigration
NonimmigrantsImmigrantsAfghanistanAfricaAlbaniaArgentinaArmeniaAsiaAustraliaAustriaBahamasBangladeshBarbadosBelarusBelgiumBelizeBoliviaBosnia and HerzegovinaBrazilBulgariaBurma/MyanmarCabo VerdeCambodiaCameroonCanadaCaribbeanCentral AmericaChileChinaColombiaCongoCosta RicaCroatiaCubaCzechoslovakiaDenmarkDominicaDominican RepublicEastern AfricaEastern AsiaEastern EuropeEcuadorEgyptEl SalvadorEnglandEritreaEthiopiaEuropeFijiFranceGermanyGhanaGreeceGrenadaGuatemalaGuyanaHaitiHondurasHong KongHungaryIndiaIndonesiaIranIraqIrelandIsraelItalyJamaicaJapanJordanKazakhstanKenyaKoreaKuwaitLaosLatin AmericaLatviaLebanonLiberiaLithuaniaMalaysiaMexicoMicronesiaMiddle AfricaMoldovaMoroccoNepalNetherlandsNicaraguaNigeriaNorth AmericaNorth MacedoniaNorthern AfricaNorwayOceaniaPakistanPanamaPeruPhilippinesPolandPortugalRomaniaRussiaSaudi ArabiaScotlandSenegalSerbiaSierra LeoneSingaporeSomaliaSouth AfricaSouth AmericaSouth Central AsiaSouth Eastern AsiaSouthern EuropeSpainSri LankaSt. Vincent and the GrenadinesSudanSwedenSwitzerlandSyriaTaiwanThailandTrinidad and TobagoTurkeyUgandaUkraineUruguayUzbekistanVenezuelaVietnamWest IndiesWestern AfricaWestern AsiaWestern EuropeYemenZaireZimbabweAzores
Immigrants from Northern Europe
Race
Ancestry
AfghanAfricanAlaska NativeAlaskan AthabascanAlbanianAleutAlsatianAmericanApacheArabArapahoArgentineanArmenianAssyrian/Chaldean/SyriacAustralianAustrianBahamianBangladeshiBarbadianBasqueBelgianBelizeanBermudanBhutaneseBlackfeetBolivianBrazilianBritishBritish West IndianBulgarianBurmeseCajunCambodianCanadianCape VerdeanCarpatho RusynCelticCentral AmericanCentral American IndianCherokeeCheyenneChickasawChileanChineseChippewaChoctawColombianColvilleComancheCosta RicanCreeCreekCroatianCrowCubanCypriotCzechCzechoslovakianDanishDelawareDominicanDutchDutch West IndianEastern EuropeanEcuadorianEgyptianEnglishEstonianEthiopianEuropeanFijianFilipinoFinnishFrenchFrench American IndianFrench CanadianGermanGerman RussianGhanaianGreekGuamanian/ChamorroGuatemalanGuyaneseHaitianHmongHonduranHopiHoumaHungarianIcelanderIndian (Asian)IndonesianInupiatIranianIraqiIrishIroquoisIsraeliItalianJamaicanJapaneseJordanianKenyanKiowaKoreanLaotianLebaneseLiberianLithuanianLumbeeLuxembourgerMacedonianMalaysianMalteseMarshalleseMenomineeMexicanMexican American IndianMongolianMoroccanNative HawaiianNavajoNepaleseNew ZealanderNicaraguanNigerianNorthern EuropeanNorwegianOkinawanOsageOttawaPaiutePakistaniPalestinianPanamanianParaguayanPennsylvania GermanPeruvianPimaPolishPortuguesePotawatomiPuebloPuerto RicanPuget Sound SalishRomanianRussianSalvadoranSamoanScandinavianScotch-IrishScottishSeminoleSenegaleseSerbianShoshoneSierra LeoneanSiouxSlavicSlovakSloveneSomaliSouth AfricanSouth AmericanSouth American IndianSoviet UnionSpaniardSpanishSpanish AmericanSpanish American IndianSri LankanSubsaharan AfricanSudaneseSwedishSwissSyrianTaiwaneseThaiTlingit-HaidaTohono O'OdhamTonganTrinidadian and TobagonianTsimshianTurkishU.S. Virgin IslanderUgandanUkrainianUruguayanUteVenezuelanVietnameseWelshWest IndianYakamaYaquiYugoslavianYumanYup'ikZimbabwean
Immigration
NonimmigrantsImmigrantsAfghanistanAfricaAlbaniaArgentinaArmeniaAsiaAustraliaAustriaBahamasBangladeshBarbadosBelarusBelgiumBelizeBoliviaBosnia and HerzegovinaBrazilBulgariaBurma/MyanmarCabo VerdeCambodiaCameroonCanadaCaribbeanCentral AmericaChileChinaColombiaCongoCosta RicaCroatiaCubaCzechoslovakiaDenmarkDominicaDominican RepublicEastern AfricaEastern AsiaEastern EuropeEcuadorEgyptEl SalvadorEnglandEritreaEthiopiaEuropeFijiFranceGermanyGhanaGreeceGrenadaGuatemalaGuyanaHaitiHondurasHong KongHungaryIndiaIndonesiaIranIraqIrelandIsraelItalyJamaicaJapanJordanKazakhstanKenyaKoreaKuwaitLaosLatin AmericaLatviaLebanonLiberiaLithuaniaMalaysiaMexicoMicronesiaMiddle AfricaMoldovaMoroccoNepalNetherlandsNicaraguaNigeriaNorth AmericaNorth MacedoniaNorthern AfricaNorthern EuropeNorwayOceaniaPakistanPanamaPeruPhilippinesPolandPortugalRomaniaRussiaSaudi ArabiaScotlandSenegalSerbiaSierra LeoneSingaporeSomaliaSouth AfricaSouth AmericaSouth Central AsiaSouth Eastern AsiaSouthern EuropeSpainSri LankaSt. Vincent and the GrenadinesSudanSwedenSwitzerlandSyriaTaiwanThailandTrinidad and TobagoTurkeyUgandaUkraineUruguayUzbekistanVenezuelaVietnamWest IndiesWestern AfricaWestern AsiaWestern EuropeYemenZaireZimbabweAzores
Male Poverty
Income
Poverty
Unemployment
Labor Participation
Family Structure
Vehicle Availability
Education Level
Disability

Male Poverty Comparison

Latvians

Immigrants from Northern Europe

Exceptional
Exceptional
9.6%
MALE POVERTY
99.7/ 100
METRIC RATING
20th/ 347
METRIC RANK
9.7%
MALE POVERTY
99.5/ 100
METRIC RATING
33rd/ 347
METRIC RANK

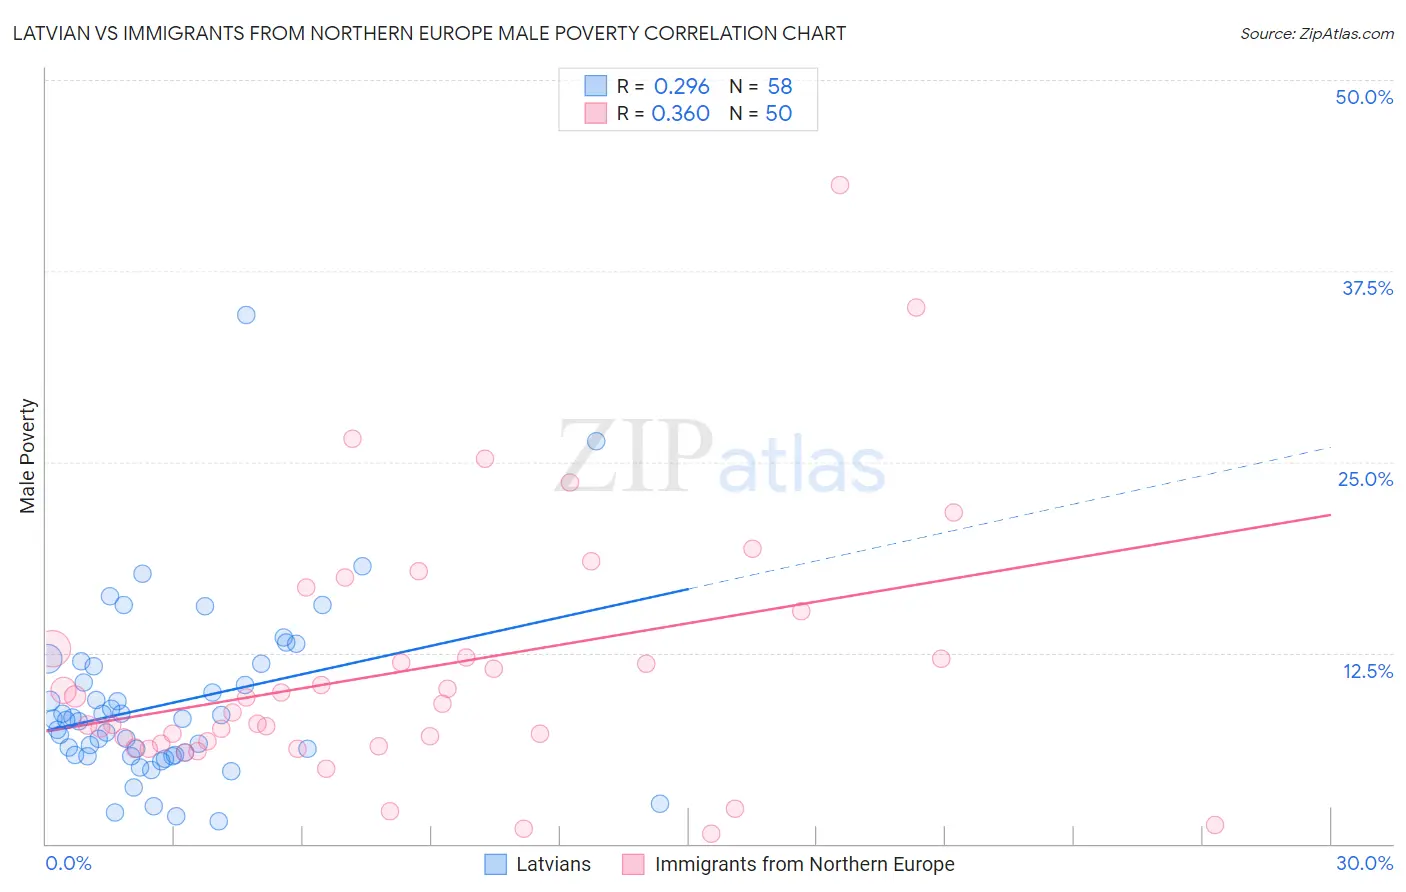
Latvian vs Immigrants from Northern Europe Male Poverty Correlation Chart

The statistical analysis conducted on geographies consisting of 220,591,162 people shows a weak positive correlation between the proportion of Latvians and poverty level among males in the United States with a correlation coefficient (R) of 0.296 and weighted average of 9.6%. Similarly, the statistical analysis conducted on geographies consisting of 476,600,632 people shows a mild positive correlation between the proportion of Immigrants from Northern Europe and poverty level among males in the United States with a correlation coefficient (R) of 0.360 and weighted average of 9.7%, a difference of 1.8%.
Latvian vs Immigrants from Northern Europe Male Poverty

Male Poverty Correlation Summary

MeasurementLatvianImmigrants from Northern Europe
Minimum1.5%0.64%
Maximum34.6%43.1%
Range33.2%42.5%
Mean9.2%11.3%
Median8.1%8.9%
Interquartile 25% (IQ1)5.8%6.5%
Interquartile 75% (IQ3)11.6%12.7%
Interquartile Range (IQR)5.8%6.2%
Standard Deviation (Sample)5.7%8.3%
Standard Deviation (Population)5.7%8.3%

Demographics Similar to Latvians and Immigrants from Northern Europe by Male Poverty

In terms of male poverty, the demographic groups most similar to Latvians are Immigrants from Hong Kong (9.6%, a difference of 0.10%), Immigrants from Scotland (9.6%, a difference of 0.26%), Lithuanian (9.5%, a difference of 0.28%), Norwegian (9.5%, a difference of 0.45%), and Croatian (9.6%, a difference of 0.51%). Similarly, the demographic groups most similar to Immigrants from Northern Europe are Macedonian (9.7%, a difference of 0.090%), Immigrants from Poland (9.8%, a difference of 0.15%), Tongan (9.7%, a difference of 0.29%), Polish (9.7%, a difference of 0.31%), and Greek (9.7%, a difference of 0.39%).
DemographicsRating | RankMale Poverty
Luxembourgers
99.8
/100
|
#16
Exceptional
9.5%
Norwegians
99.8
/100
|
#17
Exceptional
9.5%
Lithuanians
99.8
/100
|
#18
Exceptional
9.5%
Immigrants | Hong Kong
99.7
/100
|
#19
Exceptional
9.6%
Latvians
99.7
/100
|
#20
Exceptional
9.6%
Immigrants | Scotland
99.7
/100
|
#21
Exceptional
9.6%
Croatians
99.7
/100
|
#22
Exceptional
9.6%
Italians
99.7
/100
|
#23
Exceptional
9.6%
Swedes
99.7
/100
|
#24
Exceptional
9.6%
Eastern Europeans
99.6
/100
|
#25
Exceptional
9.6%
Burmese
99.6
/100
|
#26
Exceptional
9.7%
Danes
99.6
/100
|
#27
Exceptional
9.7%
Immigrants | Korea
99.6
/100
|
#28
Exceptional
9.7%
Greeks
99.6
/100
|
#29
Exceptional
9.7%
Poles
99.5
/100
|
#30
Exceptional
9.7%
Tongans
99.5
/100
|
#31
Exceptional
9.7%
Macedonians
99.5
/100
|
#32
Exceptional
9.7%
Immigrants | Northern Europe
99.5
/100
|
#33
Exceptional
9.7%
Immigrants | Poland
99.5
/100
|
#34
Exceptional
9.8%
Iranians
99.4
/100
|
#35
Exceptional
9.8%
Czechs
99.4
/100
|
#36
Exceptional
9.8%