Immigrants from Greece vs Immigrants from Northern Europe Male Poverty
COMPARE
Immigrants from Greece
Immigrants from Northern Europe
Male Poverty
Male Poverty Comparison
Immigrants from Greece
Immigrants from Northern Europe
9.8%
MALE POVERTY
99.3/ 100
METRIC RATING
37th/ 347
METRIC RANK
9.7%
MALE POVERTY
99.5/ 100
METRIC RATING
33rd/ 347
METRIC RANK
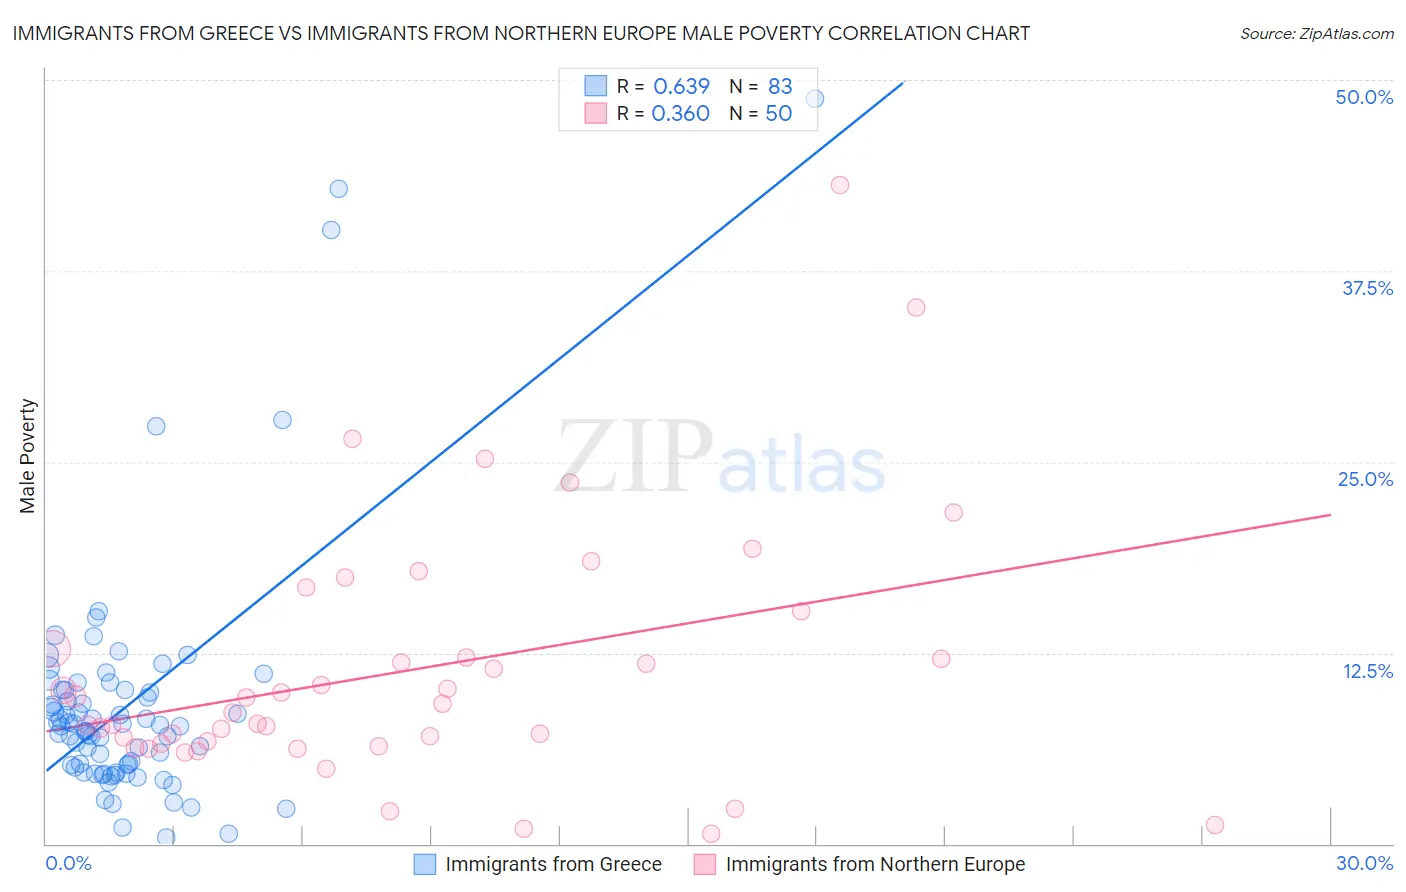
Immigrants from Greece vs Immigrants from Northern Europe Male Poverty Correlation Chart
The statistical analysis conducted on geographies consisting of 216,804,137 people shows a significant positive correlation between the proportion of Immigrants from Greece and poverty level among males in the United States with a correlation coefficient (R) of 0.639 and weighted average of 9.8%. Similarly, the statistical analysis conducted on geographies consisting of 476,600,632 people shows a mild positive correlation between the proportion of Immigrants from Northern Europe and poverty level among males in the United States with a correlation coefficient (R) of 0.360 and weighted average of 9.7%, a difference of 0.76%.
Male Poverty Correlation Summary
| Measurement | Immigrants from Greece | Immigrants from Northern Europe |
| Minimum | 0.43% | 0.64% |
| Maximum | 48.8% | 43.1% |
| Range | 48.3% | 42.5% |
| Mean | 9.2% | 11.3% |
| Median | 7.7% | 8.9% |
| Interquartile 25% (IQ1) | 5.0% | 6.5% |
| Interquartile 75% (IQ3) | 10.1% | 12.7% |
| Interquartile Range (IQR) | 5.1% | 6.2% |
| Standard Deviation (Sample) | 8.1% | 8.3% |
| Standard Deviation (Population) | 8.1% | 8.3% |
Demographics Similar to Immigrants from Greece and Immigrants from Northern Europe by Male Poverty
In terms of male poverty, the demographic groups most similar to Immigrants from Greece are Czech (9.8%, a difference of 0.22%), Iranian (9.8%, a difference of 0.31%), Immigrants from Pakistan (9.9%, a difference of 0.37%), Russian (9.9%, a difference of 0.38%), and Cypriot (9.9%, a difference of 0.46%). Similarly, the demographic groups most similar to Immigrants from Northern Europe are Macedonian (9.7%, a difference of 0.090%), Immigrants from Poland (9.8%, a difference of 0.15%), Tongan (9.7%, a difference of 0.29%), Polish (9.7%, a difference of 0.31%), and Greek (9.7%, a difference of 0.39%).
| Demographics | Rating | Rank | Male Poverty |
| Eastern Europeans | 99.6 /100 | #25 | Exceptional 9.6% |
| Burmese | 99.6 /100 | #26 | Exceptional 9.7% |
| Danes | 99.6 /100 | #27 | Exceptional 9.7% |
| Immigrants | Korea | 99.6 /100 | #28 | Exceptional 9.7% |
| Greeks | 99.6 /100 | #29 | Exceptional 9.7% |
| Poles | 99.5 /100 | #30 | Exceptional 9.7% |
| Tongans | 99.5 /100 | #31 | Exceptional 9.7% |
| Macedonians | 99.5 /100 | #32 | Exceptional 9.7% |
| Immigrants | Northern Europe | 99.5 /100 | #33 | Exceptional 9.7% |
| Immigrants | Poland | 99.5 /100 | #34 | Exceptional 9.8% |
| Iranians | 99.4 /100 | #35 | Exceptional 9.8% |
| Czechs | 99.4 /100 | #36 | Exceptional 9.8% |
| Immigrants | Greece | 99.3 /100 | #37 | Exceptional 9.8% |
| Immigrants | Pakistan | 99.2 /100 | #38 | Exceptional 9.9% |
| Russians | 99.2 /100 | #39 | Exceptional 9.9% |
| Cypriots | 99.2 /100 | #40 | Exceptional 9.9% |
| Koreans | 99.2 /100 | #41 | Exceptional 9.9% |
| Immigrants | Iran | 99.1 /100 | #42 | Exceptional 9.9% |
| Immigrants | Moldova | 99.0 /100 | #43 | Exceptional 9.9% |
| Immigrants | Romania | 98.9 /100 | #44 | Exceptional 9.9% |
| Immigrants | Serbia | 98.9 /100 | #45 | Exceptional 10.0% |