Laotian vs Somali Single Mother Poverty
COMPARE
Laotian
Somali
Single Mother Poverty
Single Mother Poverty Comparison
Laotians
Somalis
27.0%
SINGLE MOTHER POVERTY
99.8/ 100
METRIC RATING
50th/ 347
METRIC RANK
32.6%
SINGLE MOTHER POVERTY
0.0/ 100
METRIC RATING
288th/ 347
METRIC RANK
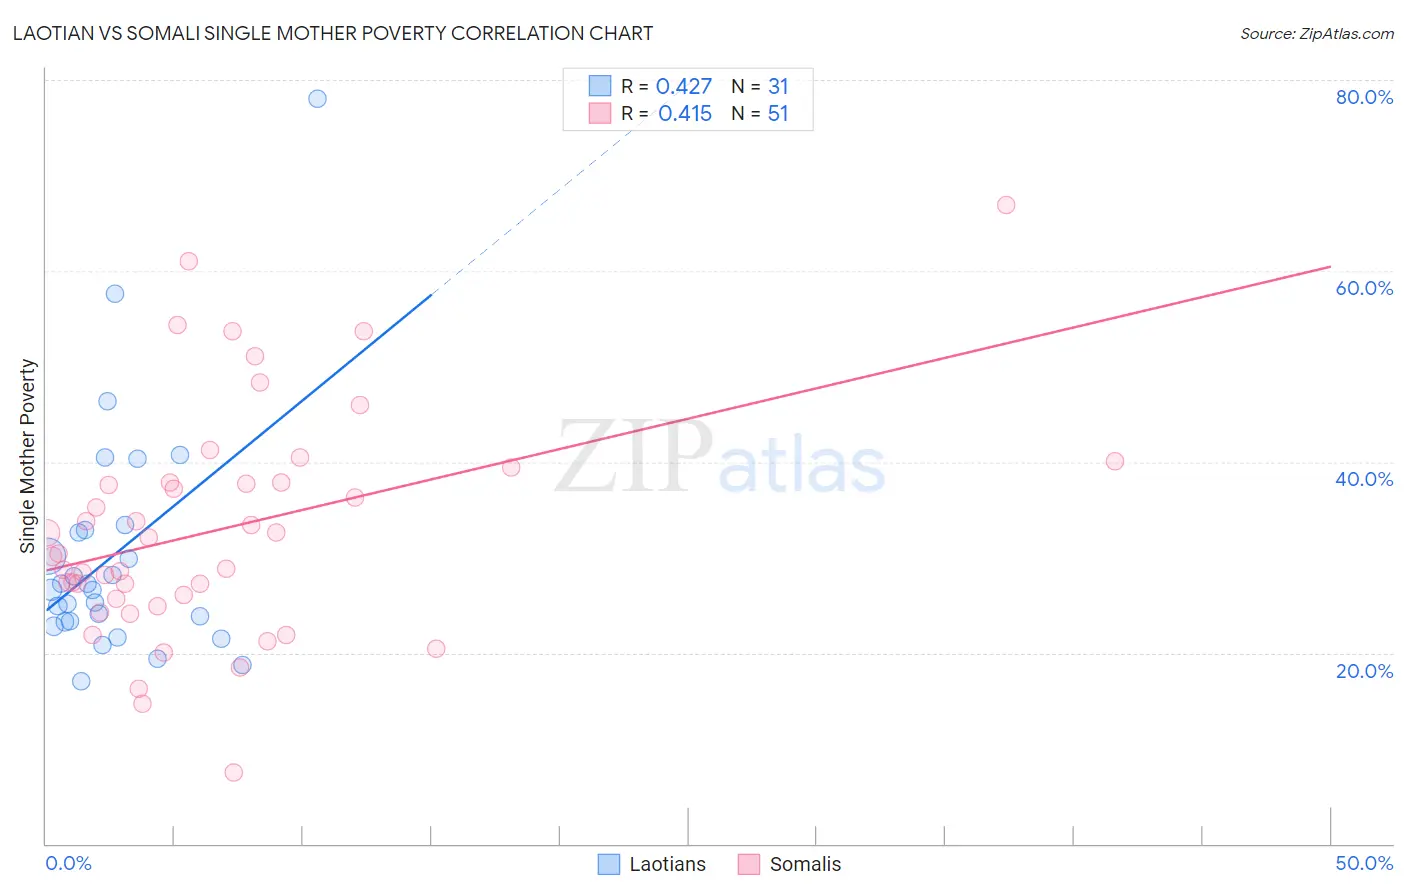
Laotian vs Somali Single Mother Poverty Correlation Chart
The statistical analysis conducted on geographies consisting of 221,717,898 people shows a moderate positive correlation between the proportion of Laotians and poverty level among single mothers in the United States with a correlation coefficient (R) of 0.427 and weighted average of 27.0%. Similarly, the statistical analysis conducted on geographies consisting of 98,871,600 people shows a moderate positive correlation between the proportion of Somalis and poverty level among single mothers in the United States with a correlation coefficient (R) of 0.415 and weighted average of 32.6%, a difference of 20.8%.
Single Mother Poverty Correlation Summary
| Measurement | Laotian | Somali |
| Minimum | 17.0% | 7.5% |
| Maximum | 78.0% | 66.9% |
| Range | 60.9% | 59.4% |
| Mean | 30.2% | 33.0% |
| Median | 26.6% | 30.4% |
| Interquartile 25% (IQ1) | 23.3% | 25.7% |
| Interquartile 75% (IQ3) | 32.8% | 37.9% |
| Interquartile Range (IQR) | 9.6% | 12.2% |
| Standard Deviation (Sample) | 12.5% | 11.9% |
| Standard Deviation (Population) | 12.3% | 11.8% |
Similar Demographics by Single Mother Poverty
Demographics Similar to Laotians by Single Mother Poverty
In terms of single mother poverty, the demographic groups most similar to Laotians are Cambodian (27.0%, a difference of 0.010%), Immigrants from Poland (26.9%, a difference of 0.090%), Egyptian (26.9%, a difference of 0.17%), Immigrants from Serbia (26.9%, a difference of 0.23%), and Latvian (26.9%, a difference of 0.27%).
| Demographics | Rating | Rank | Single Mother Poverty |
| Tsimshian | 99.9 /100 | #43 | Exceptional 26.8% |
| Immigrants | Sierra Leone | 99.9 /100 | #44 | Exceptional 26.9% |
| Latvians | 99.9 /100 | #45 | Exceptional 26.9% |
| Immigrants | Serbia | 99.9 /100 | #46 | Exceptional 26.9% |
| Egyptians | 99.8 /100 | #47 | Exceptional 26.9% |
| Immigrants | Poland | 99.8 /100 | #48 | Exceptional 26.9% |
| Cambodians | 99.8 /100 | #49 | Exceptional 27.0% |
| Laotians | 99.8 /100 | #50 | Exceptional 27.0% |
| Immigrants | Argentina | 99.7 /100 | #51 | Exceptional 27.1% |
| Immigrants | South Eastern Asia | 99.7 /100 | #52 | Exceptional 27.1% |
| Immigrants | Jordan | 99.7 /100 | #53 | Exceptional 27.1% |
| Immigrants | Bulgaria | 99.7 /100 | #54 | Exceptional 27.1% |
| Immigrants | Egypt | 99.7 /100 | #55 | Exceptional 27.1% |
| Immigrants | Romania | 99.7 /100 | #56 | Exceptional 27.2% |
| Palestinians | 99.7 /100 | #57 | Exceptional 27.2% |
Demographics Similar to Somalis by Single Mother Poverty
In terms of single mother poverty, the demographic groups most similar to Somalis are U.S. Virgin Islander (32.6%, a difference of 0.030%), Osage (32.6%, a difference of 0.14%), Immigrants from Dominica (32.5%, a difference of 0.23%), Yup'ik (32.5%, a difference of 0.35%), and Immigrants from Latin America (32.4%, a difference of 0.43%).
| Demographics | Rating | Rank | Single Mother Poverty |
| Cree | 0.0 /100 | #281 | Tragic 32.2% |
| Immigrants | Azores | 0.0 /100 | #282 | Tragic 32.2% |
| Spanish Americans | 0.0 /100 | #283 | Tragic 32.3% |
| Indonesians | 0.0 /100 | #284 | Tragic 32.4% |
| Immigrants | Latin America | 0.0 /100 | #285 | Tragic 32.4% |
| Yup'ik | 0.0 /100 | #286 | Tragic 32.5% |
| Immigrants | Dominica | 0.0 /100 | #287 | Tragic 32.5% |
| Somalis | 0.0 /100 | #288 | Tragic 32.6% |
| U.S. Virgin Islanders | 0.0 /100 | #289 | Tragic 32.6% |
| Osage | 0.0 /100 | #290 | Tragic 32.6% |
| Guatemalans | 0.0 /100 | #291 | Tragic 32.9% |
| Shoshone | 0.0 /100 | #292 | Tragic 32.9% |
| Aleuts | 0.0 /100 | #293 | Tragic 32.9% |
| French American Indians | 0.0 /100 | #294 | Tragic 33.1% |
| Yaqui | 0.0 /100 | #295 | Tragic 33.1% |