Laotian vs Immigrants from Ireland Single Mother Poverty
COMPARE
Laotian
Immigrants from Ireland
Single Mother Poverty
Single Mother Poverty Comparison
Laotians
Immigrants from Ireland
27.0%
SINGLE MOTHER POVERTY
99.8/ 100
METRIC RATING
50th/ 347
METRIC RANK
25.8%
SINGLE MOTHER POVERTY
100.0/ 100
METRIC RATING
15th/ 347
METRIC RANK
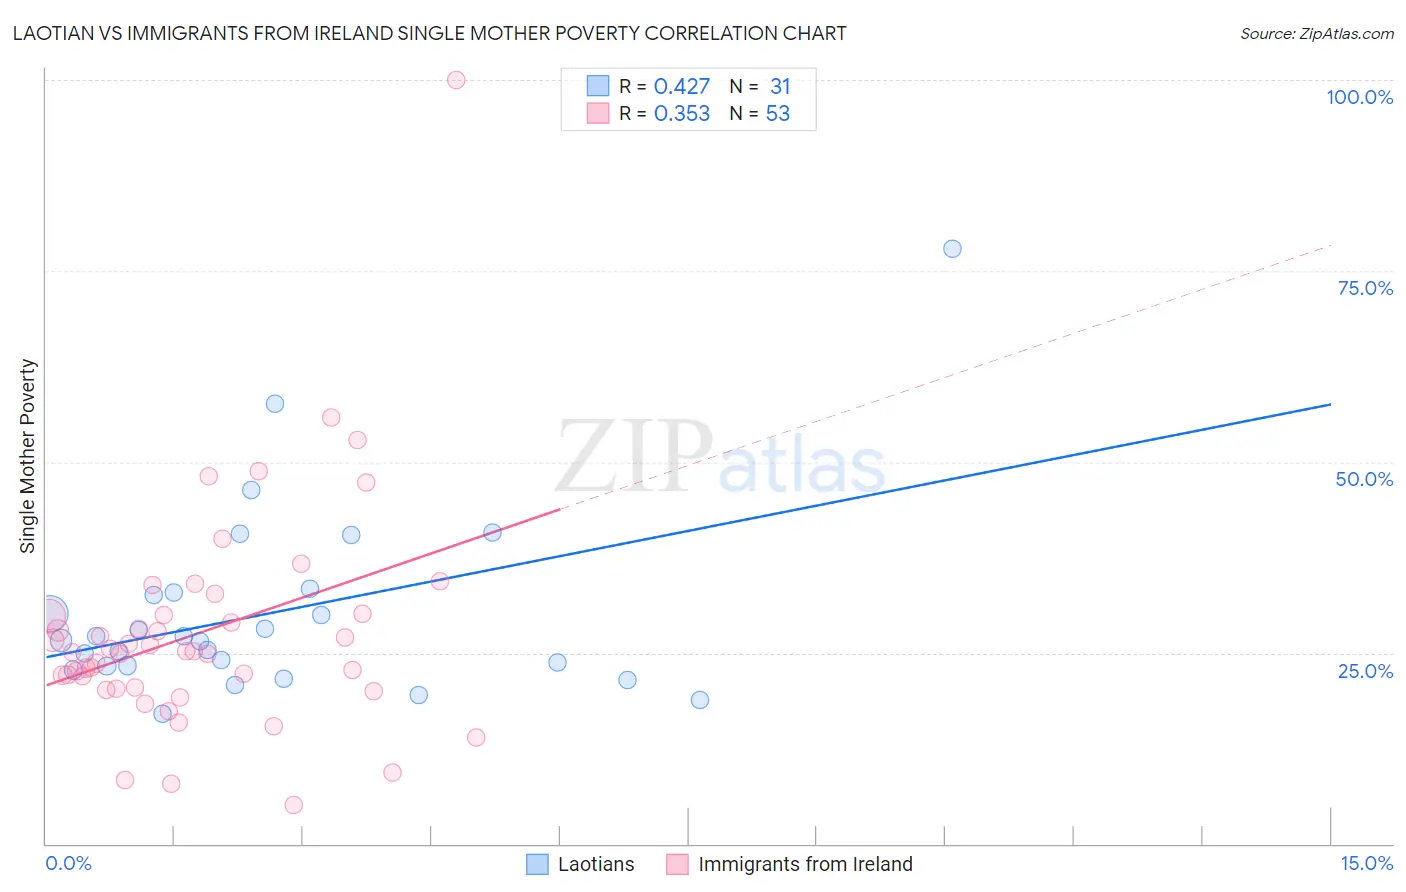
Laotian vs Immigrants from Ireland Single Mother Poverty Correlation Chart
The statistical analysis conducted on geographies consisting of 221,717,898 people shows a moderate positive correlation between the proportion of Laotians and poverty level among single mothers in the United States with a correlation coefficient (R) of 0.427 and weighted average of 27.0%. Similarly, the statistical analysis conducted on geographies consisting of 234,765,496 people shows a mild positive correlation between the proportion of Immigrants from Ireland and poverty level among single mothers in the United States with a correlation coefficient (R) of 0.353 and weighted average of 25.8%, a difference of 4.3%.
Single Mother Poverty Correlation Summary
| Measurement | Laotian | Immigrants from Ireland |
| Minimum | 17.0% | 5.0% |
| Maximum | 78.0% | 100.0% |
| Range | 60.9% | 95.0% |
| Mean | 30.2% | 27.7% |
| Median | 26.6% | 25.2% |
| Interquartile 25% (IQ1) | 23.3% | 20.3% |
| Interquartile 75% (IQ3) | 32.8% | 30.0% |
| Interquartile Range (IQR) | 9.6% | 9.7% |
| Standard Deviation (Sample) | 12.5% | 14.7% |
| Standard Deviation (Population) | 12.3% | 14.5% |
Similar Demographics by Single Mother Poverty
Demographics Similar to Laotians by Single Mother Poverty
In terms of single mother poverty, the demographic groups most similar to Laotians are Cambodian (27.0%, a difference of 0.010%), Immigrants from Poland (26.9%, a difference of 0.090%), Egyptian (26.9%, a difference of 0.17%), Immigrants from Serbia (26.9%, a difference of 0.23%), and Latvian (26.9%, a difference of 0.27%).
| Demographics | Rating | Rank | Single Mother Poverty |
| Tsimshian | 99.9 /100 | #43 | Exceptional 26.8% |
| Immigrants | Sierra Leone | 99.9 /100 | #44 | Exceptional 26.9% |
| Latvians | 99.9 /100 | #45 | Exceptional 26.9% |
| Immigrants | Serbia | 99.9 /100 | #46 | Exceptional 26.9% |
| Egyptians | 99.8 /100 | #47 | Exceptional 26.9% |
| Immigrants | Poland | 99.8 /100 | #48 | Exceptional 26.9% |
| Cambodians | 99.8 /100 | #49 | Exceptional 27.0% |
| Laotians | 99.8 /100 | #50 | Exceptional 27.0% |
| Immigrants | Argentina | 99.7 /100 | #51 | Exceptional 27.1% |
| Immigrants | South Eastern Asia | 99.7 /100 | #52 | Exceptional 27.1% |
| Immigrants | Jordan | 99.7 /100 | #53 | Exceptional 27.1% |
| Immigrants | Bulgaria | 99.7 /100 | #54 | Exceptional 27.1% |
| Immigrants | Egypt | 99.7 /100 | #55 | Exceptional 27.1% |
| Immigrants | Romania | 99.7 /100 | #56 | Exceptional 27.2% |
| Palestinians | 99.7 /100 | #57 | Exceptional 27.2% |
Demographics Similar to Immigrants from Ireland by Single Mother Poverty
In terms of single mother poverty, the demographic groups most similar to Immigrants from Ireland are Immigrants from Singapore (25.8%, a difference of 0.18%), Bolivian (25.9%, a difference of 0.29%), Indian (Asian) (25.8%, a difference of 0.34%), Asian (26.0%, a difference of 0.47%), and Immigrants from Pakistan (26.0%, a difference of 0.75%).
| Demographics | Rating | Rank | Single Mother Poverty |
| Immigrants | Iran | 100.0 /100 | #8 | Exceptional 25.1% |
| Immigrants | Lithuania | 100.0 /100 | #9 | Exceptional 25.2% |
| Immigrants | South Central Asia | 100.0 /100 | #10 | Exceptional 25.3% |
| Iranians | 100.0 /100 | #11 | Exceptional 25.5% |
| Bhutanese | 100.0 /100 | #12 | Exceptional 25.6% |
| Indians (Asian) | 100.0 /100 | #13 | Exceptional 25.8% |
| Immigrants | Singapore | 100.0 /100 | #14 | Exceptional 25.8% |
| Immigrants | Ireland | 100.0 /100 | #15 | Exceptional 25.8% |
| Bolivians | 100.0 /100 | #16 | Exceptional 25.9% |
| Asians | 100.0 /100 | #17 | Exceptional 26.0% |
| Immigrants | Pakistan | 100.0 /100 | #18 | Exceptional 26.0% |
| Immigrants | Eastern Asia | 100.0 /100 | #19 | Exceptional 26.1% |
| Immigrants | China | 100.0 /100 | #20 | Exceptional 26.1% |
| Immigrants | Bolivia | 100.0 /100 | #21 | Exceptional 26.2% |
| Immigrants | Korea | 100.0 /100 | #22 | Exceptional 26.2% |