Laotian vs Carpatho Rusyn Female Poverty
COMPARE
Laotian
Carpatho Rusyn
Female Poverty
Female Poverty Comparison
Laotians
Carpatho Rusyns
12.6%
FEMALE POVERTY
93.4/ 100
METRIC RATING
107th/ 347
METRIC RANK
12.2%
FEMALE POVERTY
97.6/ 100
METRIC RATING
71st/ 347
METRIC RANK
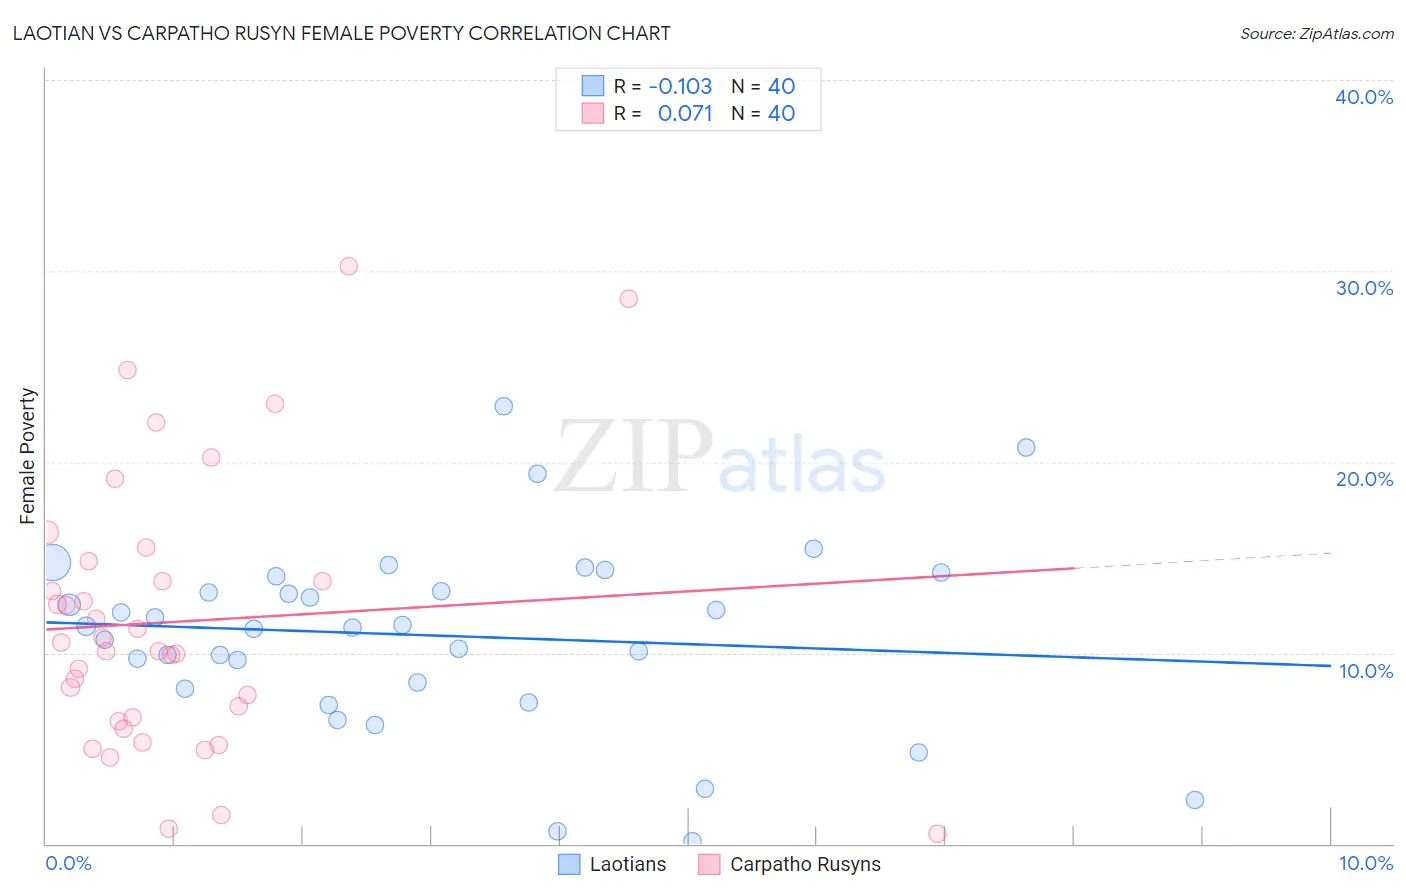
Laotian vs Carpatho Rusyn Female Poverty Correlation Chart
The statistical analysis conducted on geographies consisting of 224,727,554 people shows a poor negative correlation between the proportion of Laotians and poverty level among females in the United States with a correlation coefficient (R) of -0.103 and weighted average of 12.6%. Similarly, the statistical analysis conducted on geographies consisting of 58,861,278 people shows a slight positive correlation between the proportion of Carpatho Rusyns and poverty level among females in the United States with a correlation coefficient (R) of 0.071 and weighted average of 12.2%, a difference of 2.8%.
Female Poverty Correlation Summary
| Measurement | Laotian | Carpatho Rusyn |
| Minimum | 0.15% | 0.50% |
| Maximum | 22.9% | 30.2% |
| Range | 22.8% | 29.7% |
| Mean | 10.9% | 11.6% |
| Median | 11.4% | 10.3% |
| Interquartile 25% (IQ1) | 8.3% | 6.5% |
| Interquartile 75% (IQ3) | 13.6% | 14.3% |
| Interquartile Range (IQR) | 5.3% | 7.8% |
| Standard Deviation (Sample) | 4.8% | 7.1% |
| Standard Deviation (Population) | 4.8% | 7.0% |
Similar Demographics by Female Poverty
Demographics Similar to Laotians by Female Poverty
In terms of female poverty, the demographic groups most similar to Laotians are Portuguese (12.6%, a difference of 0.10%), Immigrants from Zimbabwe (12.6%, a difference of 0.12%), Paraguayan (12.6%, a difference of 0.15%), Immigrants from Turkey (12.6%, a difference of 0.19%), and Scottish (12.5%, a difference of 0.31%).
| Demographics | Rating | Rank | Female Poverty |
| Immigrants | Latvia | 94.8 /100 | #100 | Exceptional 12.5% |
| Tlingit-Haida | 94.8 /100 | #101 | Exceptional 12.5% |
| Immigrants | China | 94.5 /100 | #102 | Exceptional 12.5% |
| Slavs | 94.5 /100 | #103 | Exceptional 12.5% |
| Palestinians | 94.3 /100 | #104 | Exceptional 12.5% |
| Scottish | 94.1 /100 | #105 | Exceptional 12.5% |
| Immigrants | Turkey | 93.8 /100 | #106 | Exceptional 12.6% |
| Laotians | 93.4 /100 | #107 | Exceptional 12.6% |
| Portuguese | 93.1 /100 | #108 | Exceptional 12.6% |
| Immigrants | Zimbabwe | 93.1 /100 | #109 | Exceptional 12.6% |
| Paraguayans | 93.0 /100 | #110 | Exceptional 12.6% |
| Soviet Union | 92.4 /100 | #111 | Exceptional 12.6% |
| Immigrants | Israel | 92.0 /100 | #112 | Exceptional 12.6% |
| Canadians | 92.0 /100 | #113 | Exceptional 12.7% |
| Welsh | 91.6 /100 | #114 | Exceptional 12.7% |
Demographics Similar to Carpatho Rusyns by Female Poverty
In terms of female poverty, the demographic groups most similar to Carpatho Rusyns are Cambodian (12.2%, a difference of 0.030%), Zimbabwean (12.3%, a difference of 0.050%), Immigrants from Canada (12.3%, a difference of 0.060%), Immigrants from Belgium (12.2%, a difference of 0.13%), and Swiss (12.2%, a difference of 0.15%).
| Demographics | Rating | Rank | Female Poverty |
| Germans | 98.0 /100 | #64 | Exceptional 12.2% |
| Indians (Asian) | 97.9 /100 | #65 | Exceptional 12.2% |
| Austrians | 97.9 /100 | #66 | Exceptional 12.2% |
| Immigrants | Eastern Asia | 97.8 /100 | #67 | Exceptional 12.2% |
| Immigrants | Netherlands | 97.8 /100 | #68 | Exceptional 12.2% |
| Swiss | 97.7 /100 | #69 | Exceptional 12.2% |
| Immigrants | Belgium | 97.7 /100 | #70 | Exceptional 12.2% |
| Carpatho Rusyns | 97.6 /100 | #71 | Exceptional 12.2% |
| Cambodians | 97.5 /100 | #72 | Exceptional 12.2% |
| Zimbabweans | 97.5 /100 | #73 | Exceptional 12.3% |
| Immigrants | Canada | 97.5 /100 | #74 | Exceptional 12.3% |
| Europeans | 97.4 /100 | #75 | Exceptional 12.3% |
| Immigrants | Eastern Europe | 97.2 /100 | #76 | Exceptional 12.3% |
| Serbians | 97.2 /100 | #77 | Exceptional 12.3% |
| Egyptians | 97.2 /100 | #78 | Exceptional 12.3% |