Kiowa vs Croatian Single Mother Poverty

COMPARE

Kiowa
Race
Ancestry
AfghanAfricanAlaska NativeAlaskan AthabascanAlbanianAleutAlsatianAmericanApacheArabArapahoArgentineanArmenianAssyrian/Chaldean/SyriacAustralianAustrianBahamianBangladeshiBarbadianBasqueBelgianBelizeanBermudanBhutaneseBlackfeetBolivianBrazilianBritishBritish West IndianBulgarianBurmeseCajunCambodianCanadianCape VerdeanCarpatho RusynCelticCentral AmericanCentral American IndianCherokeeCheyenneChickasawChileanChineseChippewaChoctawColombianColvilleComancheCosta RicanCreeCreekCrowCubanCypriotCzechCzechoslovakianDanishDelawareDominicanDutchDutch West IndianEastern EuropeanEcuadorianEgyptianEnglishEstonianEthiopianEuropeanFijianFilipinoFinnishFrenchFrench American IndianFrench CanadianGermanGerman RussianGhanaianGreekGuamanian/ChamorroGuatemalanGuyaneseHaitianHmongHonduranHopiHoumaHungarianIcelanderIndian (Asian)IndonesianInupiatIranianIraqiIrishIroquoisIsraeliItalianJamaicanJapaneseJordanianKenyanKiowaKoreanLaotianLatvianLebaneseLiberianLithuanianLumbeeLuxembourgerMacedonianMalaysianMalteseMarshalleseMenomineeMexicanMexican American IndianMongolianMoroccanNative HawaiianNavajoNepaleseNew ZealanderNicaraguanNigerianNorthern EuropeanNorwegianOkinawanOsageOttawaPaiutePakistaniPalestinianPanamanianParaguayanPennsylvania GermanPeruvianPimaPolishPortuguesePotawatomiPuebloPuerto RicanPuget Sound SalishRomanianRussianSalvadoranSamoanScandinavianScotch-IrishScottishSeminoleSenegaleseSerbianShoshoneSierra LeoneanSiouxSlavicSlovakSloveneSomaliSouth AfricanSouth AmericanSouth American IndianSoviet UnionSpaniardSpanishSpanish AmericanSpanish American IndianSri LankanSubsaharan AfricanSudaneseSwedishSwissSyrianTaiwaneseThaiTlingit-HaidaTohono O'OdhamTonganTrinidadian and TobagonianTsimshianTurkishU.S. Virgin IslanderUgandanUkrainianUruguayanUteVenezuelanVietnameseWelshWest IndianYakamaYaquiYugoslavianYumanYup'ikZimbabwean
Immigration
NonimmigrantsImmigrantsAfghanistanAfricaAlbaniaArgentinaArmeniaAsiaAustraliaAustriaBahamasBangladeshBarbadosBelarusBelgiumBelizeBoliviaBosnia and HerzegovinaBrazilBulgariaBurma/MyanmarCabo VerdeCambodiaCameroonCanadaCaribbeanCentral AmericaChileChinaColombiaCongoCosta RicaCroatiaCubaCzechoslovakiaDenmarkDominicaDominican RepublicEastern AfricaEastern AsiaEastern EuropeEcuadorEgyptEl SalvadorEnglandEritreaEthiopiaEuropeFijiFranceGermanyGhanaGreeceGrenadaGuatemalaGuyanaHaitiHondurasHong KongHungaryIndiaIndonesiaIranIraqIrelandIsraelItalyJamaicaJapanJordanKazakhstanKenyaKoreaKuwaitLaosLatin AmericaLatviaLebanonLiberiaLithuaniaMalaysiaMexicoMicronesiaMiddle AfricaMoldovaMoroccoNepalNetherlandsNicaraguaNigeriaNorth AmericaNorth MacedoniaNorthern AfricaNorthern EuropeNorwayOceaniaPakistanPanamaPeruPhilippinesPolandPortugalRomaniaRussiaSaudi ArabiaScotlandSenegalSerbiaSierra LeoneSingaporeSomaliaSouth AfricaSouth AmericaSouth Central AsiaSouth Eastern AsiaSouthern EuropeSpainSri LankaSt. Vincent and the GrenadinesSudanSwedenSwitzerlandSyriaTaiwanThailandTrinidad and TobagoTurkeyUgandaUkraineUruguayUzbekistanVenezuelaVietnamWest IndiesWestern AfricaWestern AsiaWestern EuropeYemenZaireZimbabweAzores
Croatian
Race
Ancestry
AfghanAfricanAlaska NativeAlaskan AthabascanAlbanianAleutAlsatianAmericanApacheArabArapahoArgentineanArmenianAssyrian/Chaldean/SyriacAustralianAustrianBahamianBangladeshiBarbadianBasqueBelgianBelizeanBermudanBhutaneseBlackfeetBolivianBrazilianBritishBritish West IndianBulgarianBurmeseCajunCambodianCanadianCape VerdeanCarpatho RusynCelticCentral AmericanCentral American IndianCherokeeCheyenneChickasawChileanChineseChippewaChoctawColombianColvilleComancheCosta RicanCreeCreekCroatianCrowCubanCypriotCzechCzechoslovakianDanishDelawareDominicanDutchDutch West IndianEastern EuropeanEcuadorianEgyptianEnglishEstonianEthiopianEuropeanFijianFilipinoFinnishFrenchFrench American IndianFrench CanadianGermanGerman RussianGhanaianGreekGuamanian/ChamorroGuatemalanGuyaneseHaitianHmongHonduranHopiHoumaHungarianIcelanderIndian (Asian)IndonesianInupiatIranianIraqiIrishIroquoisIsraeliItalianJamaicanJapaneseJordanianKenyanKoreanLaotianLatvianLebaneseLiberianLithuanianLumbeeLuxembourgerMacedonianMalaysianMalteseMarshalleseMenomineeMexicanMexican American IndianMongolianMoroccanNative HawaiianNavajoNepaleseNew ZealanderNicaraguanNigerianNorthern EuropeanNorwegianOkinawanOsageOttawaPaiutePakistaniPalestinianPanamanianParaguayanPennsylvania GermanPeruvianPimaPolishPortuguesePotawatomiPuebloPuerto RicanPuget Sound SalishRomanianRussianSalvadoranSamoanScandinavianScotch-IrishScottishSeminoleSenegaleseSerbianShoshoneSierra LeoneanSiouxSlavicSlovakSloveneSomaliSouth AfricanSouth AmericanSouth American IndianSoviet UnionSpaniardSpanishSpanish AmericanSpanish American IndianSri LankanSubsaharan AfricanSudaneseSwedishSwissSyrianTaiwaneseThaiTlingit-HaidaTohono O'OdhamTonganTrinidadian and TobagonianTsimshianTurkishU.S. Virgin IslanderUgandanUkrainianUruguayanUteVenezuelanVietnameseWelshWest IndianYakamaYaquiYugoslavianYumanYup'ikZimbabwean
Immigration
NonimmigrantsImmigrantsAfghanistanAfricaAlbaniaArgentinaArmeniaAsiaAustraliaAustriaBahamasBangladeshBarbadosBelarusBelgiumBelizeBoliviaBosnia and HerzegovinaBrazilBulgariaBurma/MyanmarCabo VerdeCambodiaCameroonCanadaCaribbeanCentral AmericaChileChinaColombiaCongoCosta RicaCroatiaCubaCzechoslovakiaDenmarkDominicaDominican RepublicEastern AfricaEastern AsiaEastern EuropeEcuadorEgyptEl SalvadorEnglandEritreaEthiopiaEuropeFijiFranceGermanyGhanaGreeceGrenadaGuatemalaGuyanaHaitiHondurasHong KongHungaryIndiaIndonesiaIranIraqIrelandIsraelItalyJamaicaJapanJordanKazakhstanKenyaKoreaKuwaitLaosLatin AmericaLatviaLebanonLiberiaLithuaniaMalaysiaMexicoMicronesiaMiddle AfricaMoldovaMoroccoNepalNetherlandsNicaraguaNigeriaNorth AmericaNorth MacedoniaNorthern AfricaNorthern EuropeNorwayOceaniaPakistanPanamaPeruPhilippinesPolandPortugalRomaniaRussiaSaudi ArabiaScotlandSenegalSerbiaSierra LeoneSingaporeSomaliaSouth AfricaSouth AmericaSouth Central AsiaSouth Eastern AsiaSouthern EuropeSpainSri LankaSt. Vincent and the GrenadinesSudanSwedenSwitzerlandSyriaTaiwanThailandTrinidad and TobagoTurkeyUgandaUkraineUruguayUzbekistanVenezuelaVietnamWest IndiesWestern AfricaWestern AsiaWestern EuropeYemenZaireZimbabweAzores
Single Mother Poverty
Income
Poverty
Unemployment
Labor Participation
Family Structure
Vehicle Availability
Education Level
Disability

Single Mother Poverty Comparison

Kiowa

Croatians

Tragic
Exceptional
35.5%
SINGLE MOTHER POVERTY
0.0/ 100
METRIC RATING
323rd/ 347
METRIC RANK
28.2%
SINGLE MOTHER POVERTY
94.8/ 100
METRIC RATING
110th/ 347
METRIC RANK

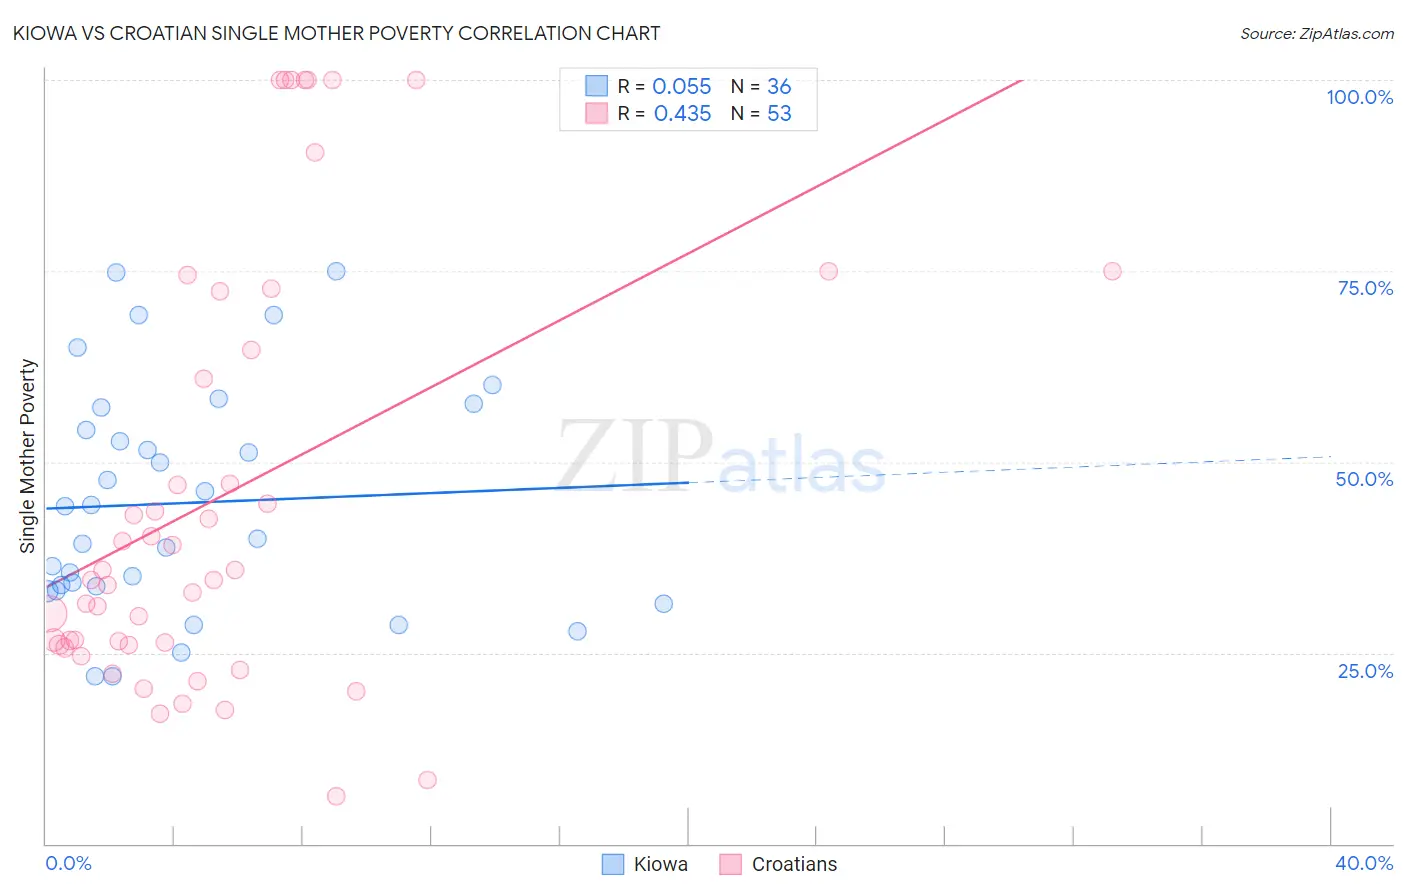
Kiowa vs Croatian Single Mother Poverty Correlation Chart

The statistical analysis conducted on geographies consisting of 55,943,976 people shows a slight positive correlation between the proportion of Kiowa and poverty level among single mothers in the United States with a correlation coefficient (R) of 0.055 and weighted average of 35.5%. Similarly, the statistical analysis conducted on geographies consisting of 364,805,698 people shows a moderate positive correlation between the proportion of Croatians and poverty level among single mothers in the United States with a correlation coefficient (R) of 0.435 and weighted average of 28.2%, a difference of 26.0%.
Kiowa vs Croatian Single Mother Poverty

Single Mother Poverty Correlation Summary

MeasurementKiowaCroatian
Minimum21.9%6.2%
Maximum75.0%100.0%
Range53.1%93.8%
Mean44.6%45.5%
Median42.1%34.6%
Interquartile 25% (IQ1)33.5%26.0%
Interquartile 75% (IQ3)55.7%68.5%
Interquartile Range (IQR)22.2%42.5%
Standard Deviation (Sample)15.0%28.0%
Standard Deviation (Population)14.7%27.7%

Similar Demographics by Single Mother Poverty

Demographics Similar to Kiowa by Single Mother Poverty

In terms of single mother poverty, the demographic groups most similar to Kiowa are Ottawa (35.5%, a difference of 0.21%), Ute (35.7%, a difference of 0.69%), Black/African American (35.2%, a difference of 0.71%), Paiute (35.1%, a difference of 0.91%), and Seminole (35.8%, a difference of 0.99%).
DemographicsRating | RankSingle Mother Poverty
Dominicans
0.0
/100
|
#316
Tragic
34.5%
Cherokee
0.0
/100
|
#317
Tragic
34.5%
Immigrants | Honduras
0.0
/100
|
#318
Tragic
34.7%
Chippewa
0.0
/100
|
#319
Tragic
34.8%
Iroquois
0.0
/100
|
#320
Tragic
34.8%
Paiute
0.0
/100
|
#321
Tragic
35.1%
Blacks/African Americans
0.0
/100
|
#322
Tragic
35.2%
Kiowa
0.0
/100
|
#323
Tragic
35.5%
Ottawa
0.0
/100
|
#324
Tragic
35.5%
Ute
0.0
/100
|
#325
Tragic
35.7%
Seminole
0.0
/100
|
#326
Tragic
35.8%
Yakama
0.0
/100
|
#327
Tragic
36.4%
Choctaw
0.0
/100
|
#328
Tragic
36.4%
Apache
0.0
/100
|
#329
Tragic
36.6%
Natives/Alaskans
0.0
/100
|
#330
Tragic
36.6%

Demographics Similar to Croatians by Single Mother Poverty

In terms of single mother poverty, the demographic groups most similar to Croatians are Venezuelan (28.2%, a difference of 0.050%), Immigrants from Kazakhstan (28.2%, a difference of 0.060%), Immigrants from Armenia (28.1%, a difference of 0.12%), Immigrants from Zimbabwe (28.1%, a difference of 0.21%), and Immigrants from Venezuela (28.1%, a difference of 0.29%).
DemographicsRating | RankSingle Mother Poverty
Immigrants | Northern Africa
96.6
/100
|
#103
Exceptional
28.0%
Italians
96.6
/100
|
#104
Exceptional
28.0%
Israelis
96.5
/100
|
#105
Exceptional
28.0%
Ukrainians
96.4
/100
|
#106
Exceptional
28.0%
Immigrants | Venezuela
95.8
/100
|
#107
Exceptional
28.1%
Immigrants | Zimbabwe
95.5
/100
|
#108
Exceptional
28.1%
Immigrants | Armenia
95.2
/100
|
#109
Exceptional
28.1%
Croatians
94.8
/100
|
#110
Exceptional
28.2%
Venezuelans
94.5
/100
|
#111
Exceptional
28.2%
Immigrants | Kazakhstan
94.5
/100
|
#112
Exceptional
28.2%
Immigrants | South Africa
93.2
/100
|
#113
Exceptional
28.3%
Immigrants | Western Asia
92.7
/100
|
#114
Exceptional
28.3%
Immigrants | Kuwait
92.7
/100
|
#115
Exceptional
28.3%
Immigrants | Uganda
92.5
/100
|
#116
Exceptional
28.3%
Australians
92.5
/100
|
#117
Exceptional
28.3%