Kiowa vs Arapaho Female Poverty
COMPARE
Kiowa
Arapaho
Female Poverty
Female Poverty Comparison
Kiowa
Arapaho
18.6%
FEMALE POVERTY
0.0/ 100
METRIC RATING
329th/ 347
METRIC RANK
17.5%
FEMALE POVERTY
0.0/ 100
METRIC RATING
321st/ 347
METRIC RANK
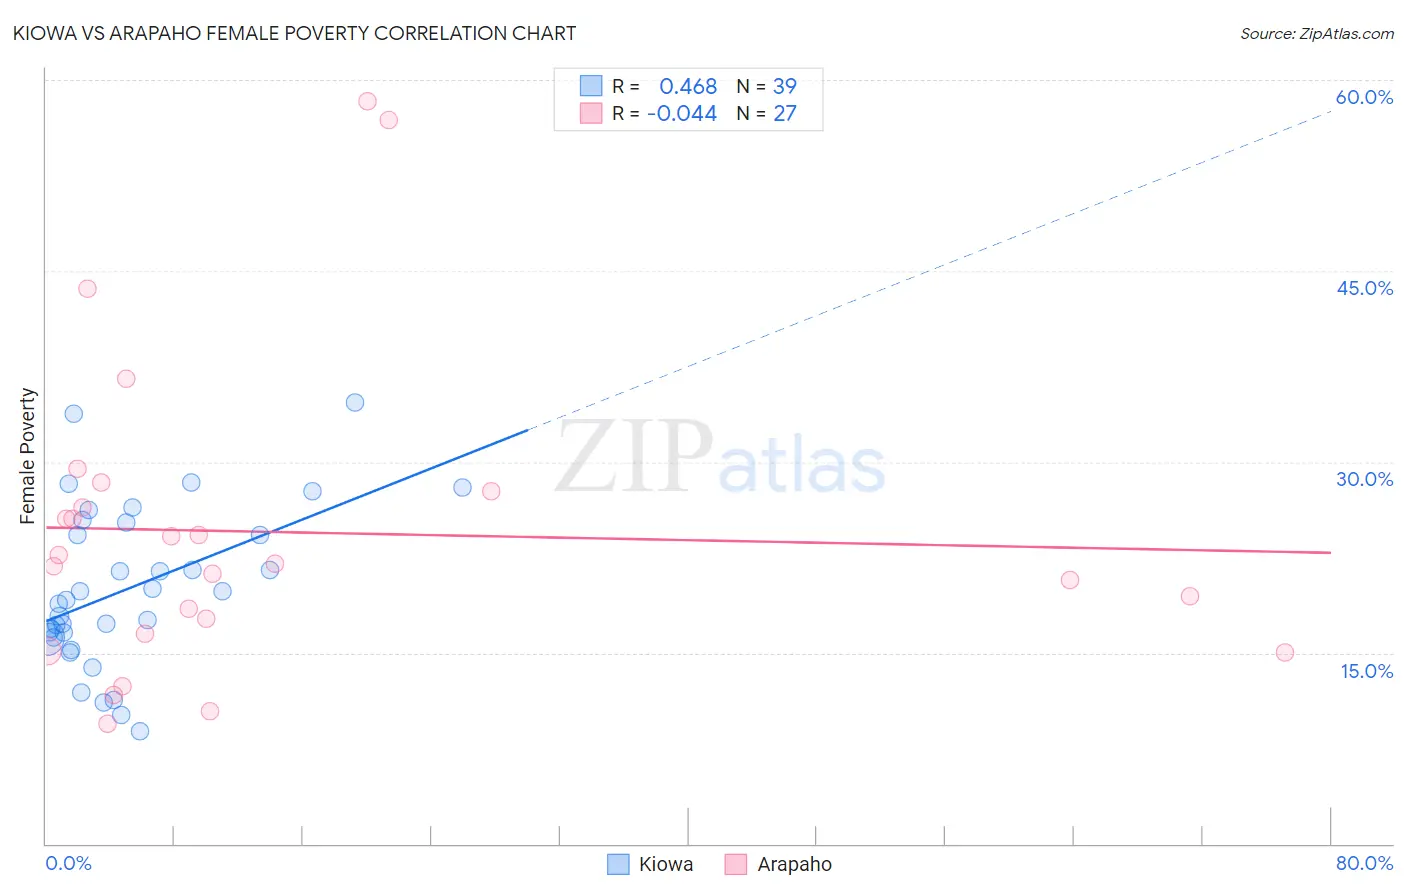
Kiowa vs Arapaho Female Poverty Correlation Chart
The statistical analysis conducted on geographies consisting of 56,097,884 people shows a moderate positive correlation between the proportion of Kiowa and poverty level among females in the United States with a correlation coefficient (R) of 0.468 and weighted average of 18.6%. Similarly, the statistical analysis conducted on geographies consisting of 29,777,916 people shows no correlation between the proportion of Arapaho and poverty level among females in the United States with a correlation coefficient (R) of -0.044 and weighted average of 17.5%, a difference of 6.5%.
Female Poverty Correlation Summary
| Measurement | Kiowa | Arapaho |
| Minimum | 8.8% | 9.4% |
| Maximum | 34.7% | 58.3% |
| Range | 25.9% | 48.9% |
| Mean | 20.1% | 24.5% |
| Median | 19.1% | 22.0% |
| Interquartile 25% (IQ1) | 16.3% | 16.5% |
| Interquartile 75% (IQ3) | 25.2% | 27.7% |
| Interquartile Range (IQR) | 9.0% | 11.2% |
| Standard Deviation (Sample) | 6.2% | 12.2% |
| Standard Deviation (Population) | 6.1% | 12.0% |
Demographics Similar to Kiowa and Arapaho by Female Poverty
In terms of female poverty, the demographic groups most similar to Kiowa are Black/African American (18.6%, a difference of 0.12%), Dominican (19.1%, a difference of 2.7%), Yakama (18.0%, a difference of 3.1%), Native/Alaskan (19.2%, a difference of 3.2%), and Central American Indian (18.0%, a difference of 3.2%). Similarly, the demographic groups most similar to Arapaho are Immigrants from Dominica (17.5%, a difference of 0.060%), Cajun (17.5%, a difference of 0.15%), Ute (17.5%, a difference of 0.16%), Immigrants from Congo (17.4%, a difference of 0.48%), and Menominee (17.6%, a difference of 0.65%).
| Demographics | Rating | Rank | Female Poverty |
| U.S. Virgin Islanders | 0.0 /100 | #315 | Tragic 17.3% |
| Hondurans | 0.0 /100 | #316 | Tragic 17.4% |
| Immigrants | Congo | 0.0 /100 | #317 | Tragic 17.4% |
| Ute | 0.0 /100 | #318 | Tragic 17.5% |
| Cajuns | 0.0 /100 | #319 | Tragic 17.5% |
| Immigrants | Dominica | 0.0 /100 | #320 | Tragic 17.5% |
| Arapaho | 0.0 /100 | #321 | Tragic 17.5% |
| Menominee | 0.0 /100 | #322 | Tragic 17.6% |
| Paiute | 0.0 /100 | #323 | Tragic 17.7% |
| Immigrants | Honduras | 0.0 /100 | #324 | Tragic 17.7% |
| Colville | 0.0 /100 | #325 | Tragic 17.8% |
| Central American Indians | 0.0 /100 | #326 | Tragic 18.0% |
| Yakama | 0.0 /100 | #327 | Tragic 18.0% |
| Blacks/African Americans | 0.0 /100 | #328 | Tragic 18.6% |
| Kiowa | 0.0 /100 | #329 | Tragic 18.6% |
| Dominicans | 0.0 /100 | #330 | Tragic 19.1% |
| Natives/Alaskans | 0.0 /100 | #331 | Tragic 19.2% |
| Apache | 0.0 /100 | #332 | Tragic 19.2% |
| Immigrants | Dominican Republic | 0.0 /100 | #333 | Tragic 19.3% |
| Houma | 0.0 /100 | #334 | Tragic 20.0% |
| Cheyenne | 0.0 /100 | #335 | Tragic 20.2% |