Ethiopian vs Arapaho Female Poverty
COMPARE
Ethiopian
Arapaho
Female Poverty
Female Poverty Comparison
Ethiopians
Arapaho
13.3%
FEMALE POVERTY
62.3/ 100
METRIC RATING
164th/ 347
METRIC RANK
17.5%
FEMALE POVERTY
0.0/ 100
METRIC RATING
321st/ 347
METRIC RANK
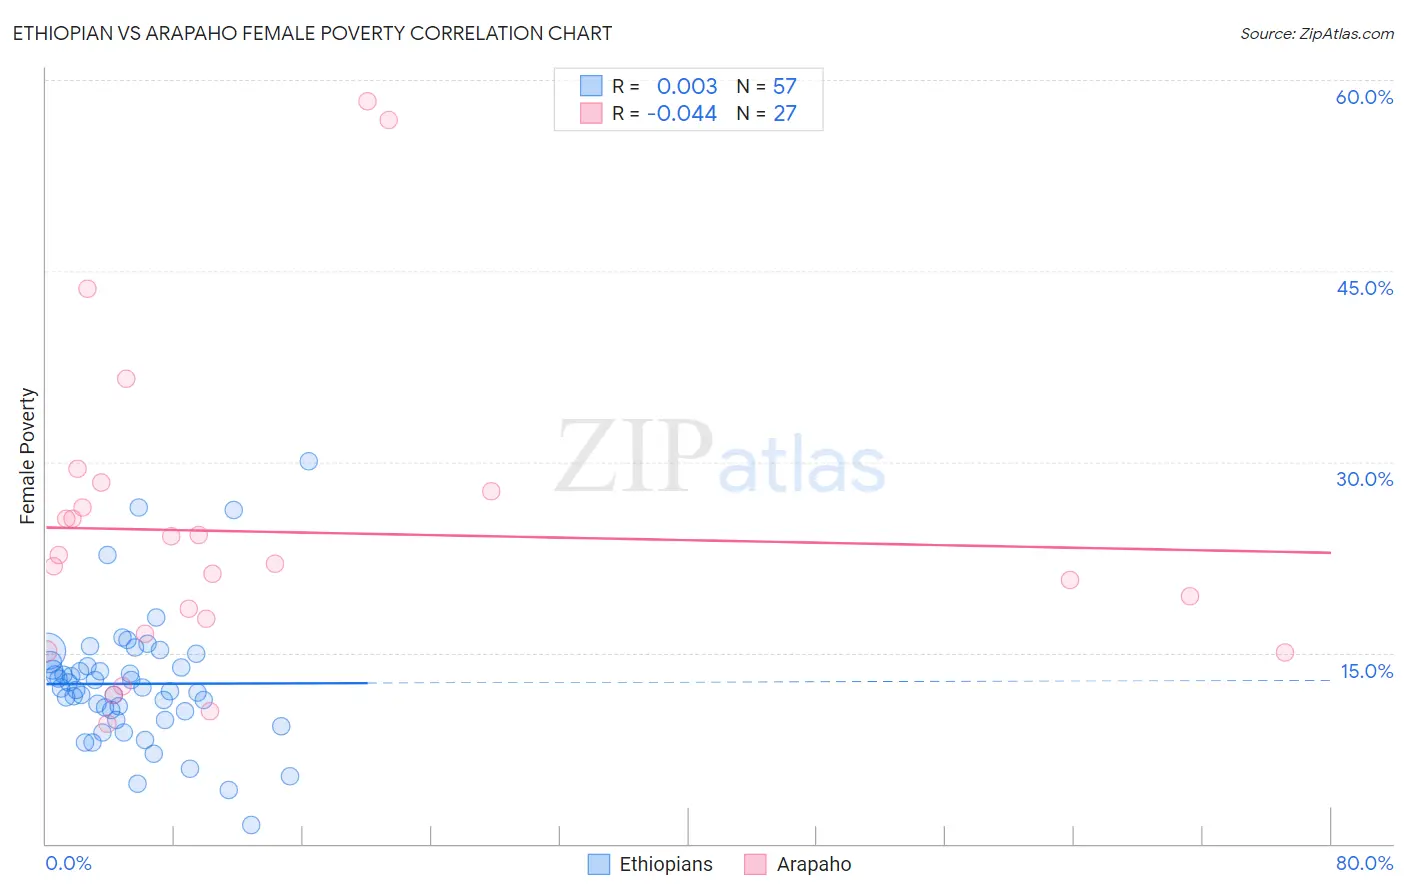
Ethiopian vs Arapaho Female Poverty Correlation Chart
The statistical analysis conducted on geographies consisting of 223,083,750 people shows no correlation between the proportion of Ethiopians and poverty level among females in the United States with a correlation coefficient (R) of 0.003 and weighted average of 13.3%. Similarly, the statistical analysis conducted on geographies consisting of 29,777,916 people shows no correlation between the proportion of Arapaho and poverty level among females in the United States with a correlation coefficient (R) of -0.044 and weighted average of 17.5%, a difference of 31.6%.
Female Poverty Correlation Summary
| Measurement | Ethiopian | Arapaho |
| Minimum | 1.5% | 9.4% |
| Maximum | 30.1% | 58.3% |
| Range | 28.6% | 48.9% |
| Mean | 12.6% | 24.5% |
| Median | 12.2% | 22.0% |
| Interquartile 25% (IQ1) | 10.1% | 16.5% |
| Interquartile 75% (IQ3) | 14.1% | 27.7% |
| Interquartile Range (IQR) | 4.0% | 11.2% |
| Standard Deviation (Sample) | 5.0% | 12.2% |
| Standard Deviation (Population) | 5.0% | 12.0% |
Similar Demographics by Female Poverty
Demographics Similar to Ethiopians by Female Poverty
In terms of female poverty, the demographic groups most similar to Ethiopians are Guamanian/Chamorro (13.3%, a difference of 0.010%), Immigrants from Albania (13.3%, a difference of 0.010%), Immigrants from Ethiopia (13.3%, a difference of 0.020%), Scotch-Irish (13.3%, a difference of 0.020%), and Immigrants from Nepal (13.3%, a difference of 0.050%).
| Demographics | Rating | Rank | Female Poverty |
| Immigrants | Northern Africa | 68.8 /100 | #157 | Good 13.2% |
| Pennsylvania Germans | 67.3 /100 | #158 | Good 13.2% |
| Costa Ricans | 63.6 /100 | #159 | Good 13.3% |
| Immigrants | Nepal | 62.7 /100 | #160 | Good 13.3% |
| Immigrants | Ethiopia | 62.5 /100 | #161 | Good 13.3% |
| Guamanians/Chamorros | 62.4 /100 | #162 | Good 13.3% |
| Immigrants | Albania | 62.4 /100 | #163 | Good 13.3% |
| Ethiopians | 62.3 /100 | #164 | Good 13.3% |
| Scotch-Irish | 62.1 /100 | #165 | Good 13.3% |
| Immigrants | Oceania | 59.7 /100 | #166 | Average 13.3% |
| Immigrants | Chile | 57.4 /100 | #167 | Average 13.3% |
| Aleuts | 56.7 /100 | #168 | Average 13.4% |
| Lebanese | 55.9 /100 | #169 | Average 13.4% |
| Colombians | 55.7 /100 | #170 | Average 13.4% |
| Whites/Caucasians | 54.6 /100 | #171 | Average 13.4% |
Demographics Similar to Arapaho by Female Poverty
In terms of female poverty, the demographic groups most similar to Arapaho are Immigrants from Dominica (17.5%, a difference of 0.060%), Cajun (17.5%, a difference of 0.15%), Ute (17.5%, a difference of 0.16%), Immigrants from Congo (17.4%, a difference of 0.48%), and Menominee (17.6%, a difference of 0.65%).
| Demographics | Rating | Rank | Female Poverty |
| Dutch West Indians | 0.0 /100 | #314 | Tragic 17.1% |
| U.S. Virgin Islanders | 0.0 /100 | #315 | Tragic 17.3% |
| Hondurans | 0.0 /100 | #316 | Tragic 17.4% |
| Immigrants | Congo | 0.0 /100 | #317 | Tragic 17.4% |
| Ute | 0.0 /100 | #318 | Tragic 17.5% |
| Cajuns | 0.0 /100 | #319 | Tragic 17.5% |
| Immigrants | Dominica | 0.0 /100 | #320 | Tragic 17.5% |
| Arapaho | 0.0 /100 | #321 | Tragic 17.5% |
| Menominee | 0.0 /100 | #322 | Tragic 17.6% |
| Paiute | 0.0 /100 | #323 | Tragic 17.7% |
| Immigrants | Honduras | 0.0 /100 | #324 | Tragic 17.7% |
| Colville | 0.0 /100 | #325 | Tragic 17.8% |
| Central American Indians | 0.0 /100 | #326 | Tragic 18.0% |
| Yakama | 0.0 /100 | #327 | Tragic 18.0% |
| Blacks/African Americans | 0.0 /100 | #328 | Tragic 18.6% |