Jordanian vs Bahamian Single Male Poverty
COMPARE
Jordanian
Bahamian
Single Male Poverty
Single Male Poverty Comparison
Jordanians
Bahamians
12.3%
SINGLE MALE POVERTY
95.9/ 100
METRIC RATING
105th/ 347
METRIC RANK
14.6%
SINGLE MALE POVERTY
0.0/ 100
METRIC RATING
291st/ 347
METRIC RANK
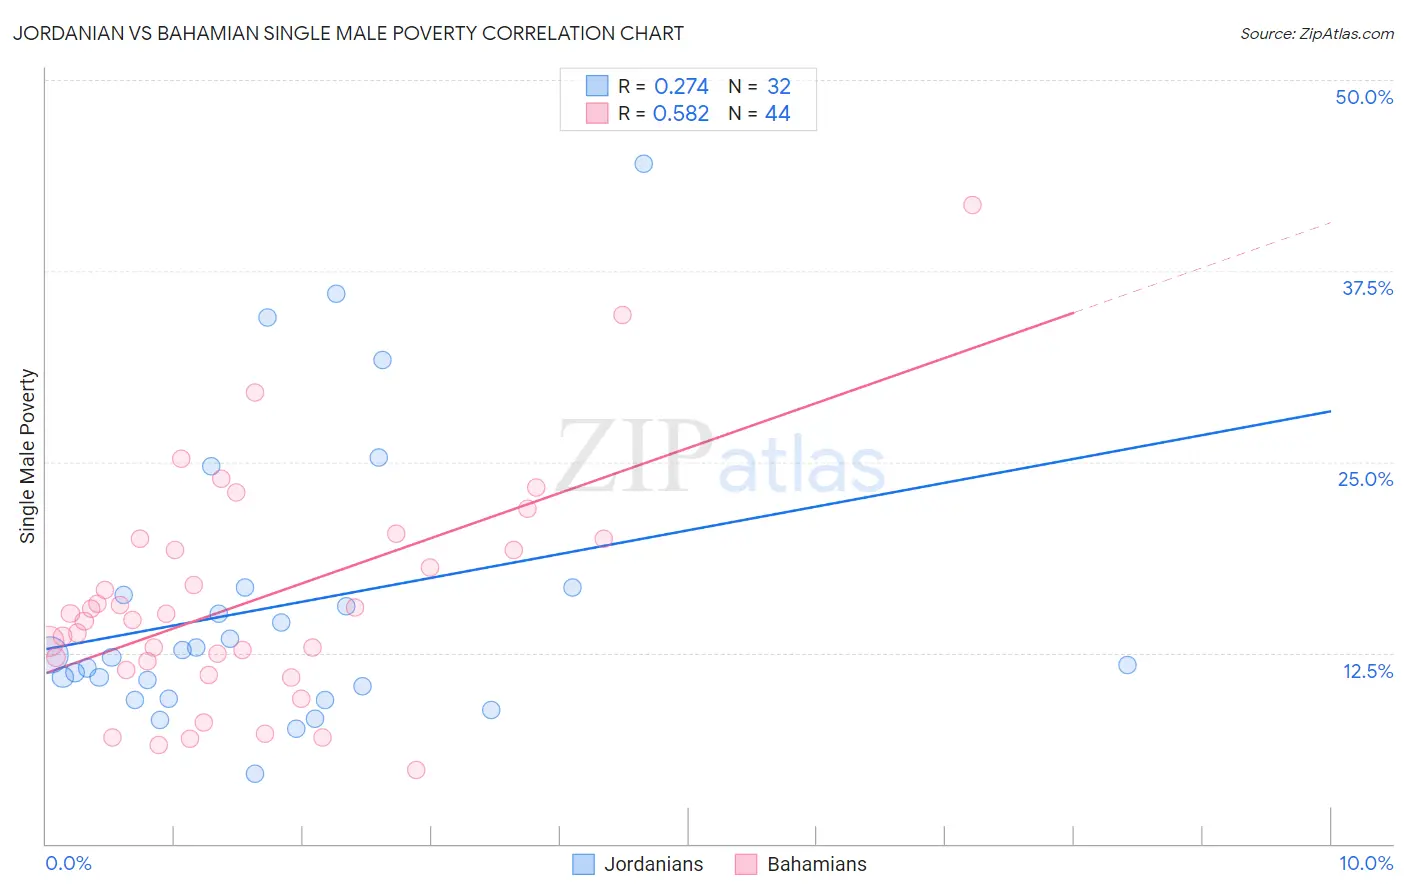
Jordanian vs Bahamian Single Male Poverty Correlation Chart
The statistical analysis conducted on geographies consisting of 156,040,584 people shows a weak positive correlation between the proportion of Jordanians and poverty level among single males in the United States with a correlation coefficient (R) of 0.274 and weighted average of 12.3%. Similarly, the statistical analysis conducted on geographies consisting of 108,151,039 people shows a substantial positive correlation between the proportion of Bahamians and poverty level among single males in the United States with a correlation coefficient (R) of 0.582 and weighted average of 14.6%, a difference of 18.6%.
Single Male Poverty Correlation Summary
| Measurement | Jordanian | Bahamian |
| Minimum | 4.6% | 4.8% |
| Maximum | 44.5% | 41.8% |
| Range | 39.9% | 37.0% |
| Mean | 15.6% | 15.9% |
| Median | 12.3% | 14.8% |
| Interquartile 25% (IQ1) | 9.9% | 11.7% |
| Interquartile 75% (IQ3) | 16.5% | 19.6% |
| Interquartile Range (IQR) | 6.6% | 7.9% |
| Standard Deviation (Sample) | 9.3% | 7.4% |
| Standard Deviation (Population) | 9.2% | 7.4% |
Similar Demographics by Single Male Poverty
Demographics Similar to Jordanians by Single Male Poverty
In terms of single male poverty, the demographic groups most similar to Jordanians are Immigrants from Morocco (12.3%, a difference of 0.080%), Iraqi (12.3%, a difference of 0.26%), Immigrants from Eastern Africa (12.3%, a difference of 0.28%), Immigrants from Kazakhstan (12.2%, a difference of 0.32%), and Immigrants from Armenia (12.2%, a difference of 0.33%).
| Demographics | Rating | Rank | Single Male Poverty |
| Guamanians/Chamorros | 97.4 /100 | #98 | Exceptional 12.2% |
| Immigrants | Cuba | 97.3 /100 | #99 | Exceptional 12.2% |
| Immigrants | Australia | 97.1 /100 | #100 | Exceptional 12.2% |
| Immigrants | Latvia | 97.0 /100 | #101 | Exceptional 12.2% |
| Immigrants | Europe | 97.0 /100 | #102 | Exceptional 12.2% |
| Immigrants | Armenia | 96.7 /100 | #103 | Exceptional 12.2% |
| Immigrants | Kazakhstan | 96.7 /100 | #104 | Exceptional 12.2% |
| Jordanians | 95.9 /100 | #105 | Exceptional 12.3% |
| Immigrants | Morocco | 95.6 /100 | #106 | Exceptional 12.3% |
| Iraqis | 95.1 /100 | #107 | Exceptional 12.3% |
| Immigrants | Eastern Africa | 95.0 /100 | #108 | Exceptional 12.3% |
| Ugandans | 94.5 /100 | #109 | Exceptional 12.3% |
| Immigrants | Portugal | 93.6 /100 | #110 | Exceptional 12.3% |
| Immigrants | North Macedonia | 93.6 /100 | #111 | Exceptional 12.3% |
| Kenyans | 93.3 /100 | #112 | Exceptional 12.4% |
Demographics Similar to Bahamians by Single Male Poverty
In terms of single male poverty, the demographic groups most similar to Bahamians are Nonimmigrants (14.6%, a difference of 0.13%), U.S. Virgin Islander (14.5%, a difference of 0.15%), French Canadian (14.6%, a difference of 0.25%), Immigrants from Dominica (14.5%, a difference of 0.38%), and Ottawa (14.6%, a difference of 0.43%).
| Demographics | Rating | Rank | Single Male Poverty |
| Immigrants | Bahamas | 0.0 /100 | #284 | Tragic 14.4% |
| French | 0.0 /100 | #285 | Tragic 14.4% |
| Celtics | 0.0 /100 | #286 | Tragic 14.5% |
| Iroquois | 0.0 /100 | #287 | Tragic 14.5% |
| Whites/Caucasians | 0.0 /100 | #288 | Tragic 14.5% |
| Immigrants | Dominica | 0.0 /100 | #289 | Tragic 14.5% |
| U.S. Virgin Islanders | 0.0 /100 | #290 | Tragic 14.5% |
| Bahamians | 0.0 /100 | #291 | Tragic 14.6% |
| Immigrants | Nonimmigrants | 0.0 /100 | #292 | Tragic 14.6% |
| French Canadians | 0.0 /100 | #293 | Tragic 14.6% |
| Ottawa | 0.0 /100 | #294 | Tragic 14.6% |
| Scotch-Irish | 0.0 /100 | #295 | Tragic 14.7% |
| Africans | 0.0 /100 | #296 | Tragic 14.7% |
| Immigrants | Dominican Republic | 0.0 /100 | #297 | Tragic 14.8% |
| French American Indians | 0.0 /100 | #298 | Tragic 15.0% |